- Charles Joseph Minard
-
Charles Joseph Minard Born 27 March 1781
Dijon, FranceDied October 24, 1870 (aged 89)
Bordeaux, FranceFields Civil engineering and information graphics Alma mater École Polytechnique Known for Carte figurative des pertes successives en hommes de l'Armée Française dans la campagne de Russie 1812-1813' Charles Joseph Minard (27 March 1781 – 24 October 1870 in Bordeaux) was a French civil engineer noted for his inventions in the field of information graphics.
Contents
Biography
Minard was born in Dijon and studied science and mathematics at the École Polytechnique, then civil engineering at École nationale des ponts et chaussées.
After working as a civil engineer on dam, canal and bridge projects throughout Europe for many years, he was appointed superintendent of the École nationale des ponts et chaussées (School of Bridges and Roads) in 1830, a position he held until 1836. He became an inspector in the Corps des Ponts (Corps of Bridges) from which he retired in 1851, dedicating himself to private research thereafter.
Work
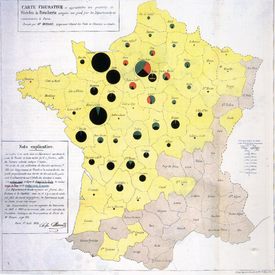
 Minard's map using pie charts to represent the cattle sent from all around France for consumption in Paris (1858).
Information graphics
Minard was a pioneer of the use of graphics in engineering and statistics. He is famous for his Carte figurative des pertes successives en hommes de l'Armée Française dans la campagne de Russie 1812-1813, a flow map published in 1869 on the subject of Napoleon's disastrous Russian campaign of 1812.
The graph displays several variables in a single two-dimensional image:
- the size of the army - providing a strong visual representation of human suffering, e.g. the sudden decrease of the army's size at the crossing of the Berezina river on the retreat;
- the geographical co-ordinates, latitude and longitude, of the army as it moved;
- the direction that the army was traveling, both in advance and in retreat, showing where units split off and rejoined;
- the location of the army with respect to certain dates; and
- the weather temperature along the path of the retreat, in another strong visualisation of events (during the retreat "one of the worst winters in recent memory set in"[1]).
Étienne-Jules Marey first called notice to this dramatic depiction of the fate of Napoleon's army in the Russian campaign, saying it "defies the pen of the historian in its brutal eloquence". Edward Tufte says it "may well be the best statistical graphic ever drawn"[2] and uses it as a prime example in The Visual Display of Quantitative Information.
Howard Wainer identified Minard's map as a "gem" of information graphics, nominating it as the "World's Champion Graph".[3]
See also
References
- ^ "Charles Joseph Minard: Mapping Napoleon's March, 1861" by John Corbett, Center for Spatially Integrated Social Science
- ^ Edward R. Tufte (2001). The Visual Display of Quantitative Information. p. 40
- ^ Howard Wainer (1984). "How to Display Data Badly". In: American Statistician 38 (2): p 146 (pg 136–147).
Further reading
- Michael Friendly (2002). Visions and re-visions of Charles Joseph Minard. Journal of Educational and Behavioral Statistics. 27 (1), 31–52.
- Edward R. Tufte (2001). The Visual Display of Quantitative Information (2nd edition ed.). Graphics Press. ISBN 0961392142.
External links
- Translation of Minard obituary, Edward Tufte
- Background on Minard's graph including original sources, Edward Tufte
- The Graphic Works of Charles Joseph Minard, Michael Friendly, York University (Ontario) Department of Mathematics and Statistics
- Minard biography, Michael Friendly
Categories:- 1781 births
- 1870 deaths
- People from Dijon
- Alumni of the École Polytechnique
- French civil engineers
- Information graphic designers
- Visualization experts
Wikimedia Foundation. 2010.

