- Bimodal distribution
-
"Bimodal" redirects here. For the musical concept, see Bimodality.
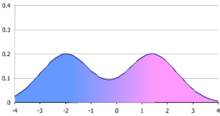
 Figure 1. A simple bimodal distribution, in this case a mixture of two normal distributions with the same variance but different means. The figure shows the probability density function (p.d.f.), which is an average of the bell-shaped p.d.f.s of the two normal distributions.
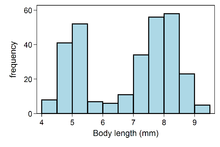
 Figure 2. Histogram of body lengths of 300 weaver ant workers.[1]
In statistics, a bimodal distribution is a continuous probability distribution with two different modes. These appear as distinct peaks (local maxima) in the probability density function, as shown in Figure 1.
Examples of variables with bimodal distributions include the time between eruptions of certain geysers, the color of galaxies, the size of worker weaver ants, the age of incidence of Hodgkin's lymphoma, the speed of inactivation of the drug isoniazid in US adults, and the absolute magnitude of novae.
Contents
Mixture distributions
A bimodal distribution most commonly arises as a mixture of two different unimodal distributions (i.e. distributions having only one mode). In other words, the bimodally distributed random variable X is defined as Y with probability α or Z with probability (1 − α), where Y and Z are unimodal random variables and 0 < α < 1 is a mixture coefficient. For example, the bimodal distribution of sizes of weaver ant workers shown in Figure 2 arises due to existence of two distinct classes of workers, namely major workers and minor workers.[1] In this case, Y would be the size of a random major worker, Z the size of a random minor worker, and α the proportion of worker weaver ants that are major workers.
A mixture of two unimodal distributions with differing means is not necessarily bimodal, however. The combined distribution of heights of men and women is sometimes used as an example of a bimodal distribution, but in fact the difference in mean heights of men and women is too small relative to their standard deviations to produce bimodality.[2] A mixture of two normal distributions with equal standard deviations is bimodal only if their means differ by at least twice the common standard deviation.[2]
Summary statistics
Bimodal distributions are a commonly-used example of how summary statistics such as the mean, median, and standard deviation can be deceptive when used on an arbitrary distribution. For example, in the distribution in Figure 1, the mean and median would be about zero, even though zero is not a typical value. The standard deviation is also larger than deviation of each normal distribution.
Multimodality
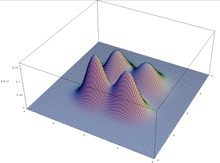
More generally, a multimodal distribution is a continuous probability distribution with two or more modes, as illustrated in Figure 3.
References
- ^ a b Weber, NA (1946). "Dimorphism in the African Oecophylla worker and an anomaly (Hym.: Formicidae)" (PDF). Annals of the Entomological Society of America 39: pp. 7–10. http://antbase.org/ants/publications/10434/10434.pdf.
- ^ a b Schilling, Mark F.; Watkins, Ann E.; Watkins, William (2002). "Is Human Height Bimodal?". The American Statistician 56 (3): 223–229. doi:10.1198/00031300265.
Categories:- Probability distributions
Wikimedia Foundation. 2010.

