- Nakagami distribution
-
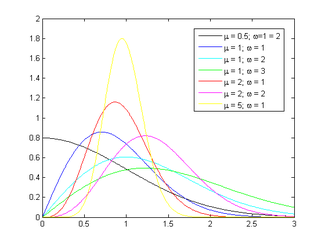
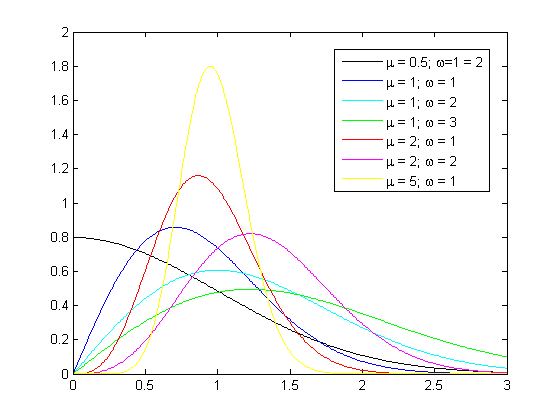
Nakagami Probability density function
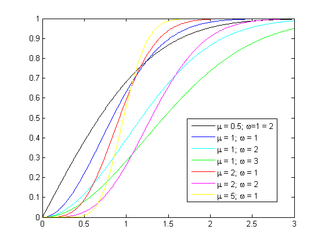
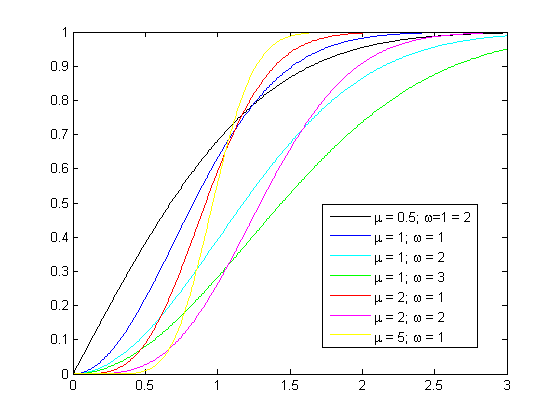
Cumulative distribution function
parameters: μ > = 0.5 shape (real)
ω > 0 spread (real)support: 
pdf: 
cdf: 
mean: 
median: 
mode: 
variance: 
The Nakagami distribution or the Nakagami-m distribution is a probability distribution related to the gamma distribution. It has two parameters: a shape parameter μ and a second parameter controlling spread, ω.
Contents
Characterization
Its probability density function (pdf) is[1]
Its cumulative distribution function is[1]
where P is the incomplete gamma function (regularized).
Parameter estimation
The parameters μ and ω are[2]
and
Generation
The Nakagami distribution is related to the gamma distribution. In particular, given a random variable
 , it is possible to obtain a random variable
  , by setting k = μ, θ = ω / μ, and taking the square root of Y:
 .
.
When 2μ is an integer, the Nakagami distribution
 can be generated from the Chi distribution with parameter k set to 2μ and then following it by the scaling transformation:[citation needed]
History and applications
The Nakagami distribution is relatively new, being first proposed in 1960.[3] It has been used to model attenuation of wireless signals traversing multiple paths.[4]
References
- ^ a b Laurenson, Dave (1994). "Nakagami Distribution". Indoor Radio Channel Propagation Modelling by Ray Tracing Techniques. http://www.see.ed.ac.uk/~dil/thesis_mosaic/section2_19.html. Retrieved 2007-08-04.
- ^ R. Kolar, R. Jirik, J. Jan (2004) "Estimator Comparison of the Nakagami-m Parameter and Its Application in Echocardiography", Radioengineering, 13 (1), 8–12
- ^ M. Nakagami. "The m-Distribution, a general formula of intensity of rapid fading". In William C. Hoffman, editor, Statistical Methods in Radio Wave Propagation: Proceedings of a Symposium held June 18-20, 1958, pp 3-36. Permagon Press, 1960.
- ^ J. D. Parsons, The Mobile Radio Propagation Channel. New York: Wiley, 1992.
Categories:- Continuous distributions
- Factorial and binomial topics


![\mu = \frac{\operatorname{E}^2 \left[X^2 \right]}
{\operatorname{Var} \left[X^2 \right]},](c/69c9c2262b5e5a6eaf1e4e09cae20c31.png)
![\omega = \operatorname{E} \left[X^2 \right].](9/1a976e40281d837a491d0276aa15c33f.png)

Wikimedia Foundation. 2010.