- Demographics of Arizona
-
Historical populations Census Pop. %± 1860 6,482 — 1870 9,658 49.0% 1880 40,440 318.7% 1890 88,243 118.2% 1900 122,931 39.3% 1910 204,354 66.2% 1920 334,162 63.5% 1930 435,573 30.3% 1940 499,261 14.6% 1950 749,587 50.1% 1960 1,302,161 73.7% 1970 1,745,944 34.1% 1980 2,718,215 55.7% 1990 3,665,228 34.8% 2000 5,130,632 40.0% 2010 6,392,017 24.6% Sources: 1910-2010[1] As of 2006, Arizona had an estimated population of 6,166,318,[2] which is an increase of 213,311, or 3.6%, from the prior year and an increase of 1,035,686, or 20.2%, since the year 2000. This includes a natural increase since the last census of 297,928 people (that is 564,062 births minus 266,134 deaths) and an increase due to net migration of 745,944 people into the state. Immigration from outside the United States resulted in a net increase of 204,661 people, and migration within the country produced a net increase of 541,283 people. New population figures for the year ending July 1, 2006, indicate that Arizona is the fastest growing state in the United States, with 3.6% population growth since 2005, exceeding the growth of the previous leader, Nevada.
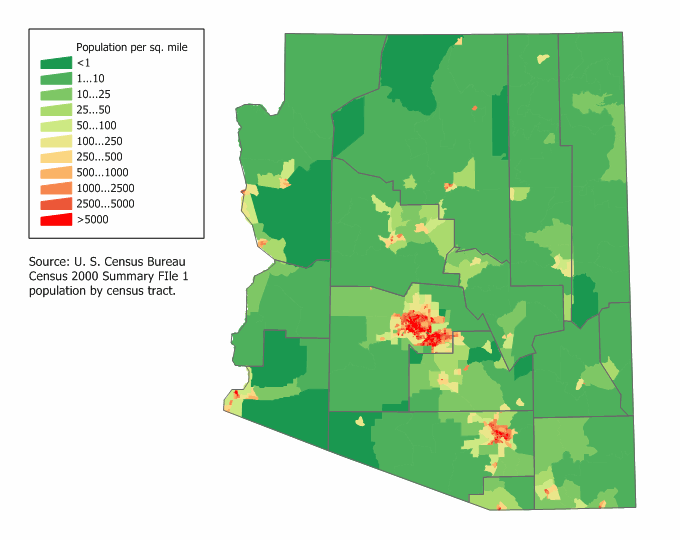
More than half (around 58%) of the population of Arizona live in cities of 100,000 or more inhabitants, the highest proportion of any of the 50 states. The population density of the state is 45.2 people per square mile.[3]
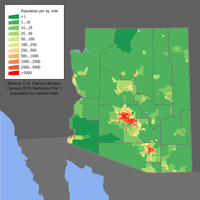 Arizona's Population Density.
The center of population of Arizona is located in Maricopa County.[4]
Contents
Race and ethnicity
Demographics of Arizona (csv) By race White Black AIAN* Asian NHPI* 2000 (total population) 89.29% 3.74% 5.81% 2.36% 0.28% 2000 (Hispanic only) 24.13% 0.41% 0.73% 0.19% 0.07% 2005 (total population) 88.74% 4.20% 5.63% 2.75% 0.31% 2005 (Hispanic only) 27.20% 0.58% 0.72% 0.23% 0.08% Growth 2000–05 (total population) 15.05% 30.11% 12.25% 35.27% 25.02% Growth 2000–05 (non-Hispanic only) 9.32% 25.75% 11.85% 34.75% 22.33% Growth 2000–05 (Hispanic only) 30.51% 65.92% 15.01% 41.10% 32.89% * AIAN is American Indian or Alaskan Native; NHPI is Native Hawaiian or Pacific Islander According to the 2005-2007 American Community Survey conducted by the U.S. Census Bureau, White Americans made up 76.4% of Arizona's population; of which 59.6% were Non-Hispanic Whites. Blacks or African Americans made up 3.4% of Arizona's population; of which 3.3% were non-Hispanic blacks. American Indians made up 4.5% of the state's population; of which 4.1% were non-Hispanic. Asian Americans made up 2.3% of the state's population. Pacific Islander Americans made up 0.1% of the state's population. Individuals from some other race made up 10.8% of the state's population; of which 0.2% were non-Hispanic. Individuals from two or more races made up 2.4% of the state's population; of which 1.4% were non-Hispanic. In addition, Hispanics and Latinos made up 29.0% of Arizona's population.[5][6]
The state has the third highest number (and the sixth highest percentage) of Native Americans of any state in the Union. 286,680 were estimated to live in Arizona, representing more than 10% of the country's total Native American population of 2,752,158. Only California and Oklahoma[7] have more Native Americans. The perimeters of Phoenix, Tucson, Prescott, Flagstaff and Yuma border on Native American reservations.
The largest ancestry groups in Arizona are Mexican (25.8%), German (16.5%), English (10.3%), Irish (10.9%), and Native American (4.5%).[8] The southern and central parts of the state are predominantly Mexican American, especially in Santa Cruz County and Yuma County near the Mexican border. The north-central and northwestern counties are largely inhabited by White Americans. The northeastern part of Arizona has many American Indians. The African American population of the Phoenix metropolitan area doubled between 1990 and 2005.[9] Asian Americans also made major contributions to the development of Arizona, such as the many Chinese who arrived in the state's mines and railroads, and the fact that over 20,000 Japanese Americans, mostly residing in the Grand Avenue section of Phoenix and farming areas of southern Arizona and the Colorado River valley, were interned during World War II. As of the 2010 US Census, Arizonans who claim Filipino ancestry exceed 53,000.[10] Filipino Americans are also the largest Asian American subgroup in the state.
Arizona is projected to become a minority-majority state by the year 2015 if current population growth trends continue. In 2003, for the first time, there were slightly more births to Hispanics in the state than births to non-Hispanic whites. Since then, the gap has widened. In 2007, Hispanics accounted for 45% of all newborns whereas non- Hispanic whites accounted for 41% of all births. All of the other races accounted for 14% of births.[citation needed]
As of the 2005-2007 American Community Survey, 72.1% of Arizonians spoke only English at home; 27.9% spoke a non-English language at home. Spanish-speakers accounted for 21.7% of Arizona's populace. About 2.1% of Arizonans spoke a different Indo-European language at home while 1.5% spoke an Asian language at home. About 2.6% spoke a different language at home.[8]
See also the list of native peoples.
Religion
According to a 2008 survey by the Pew Forum on Religion and Public Life, the most common self-reported religious affiliation of Arizona residents are:[11]
- Catholicism - 25%
- Evangelical Christian - 23%
- Non-Religious / Unaffiliated - 22%
- Protestantism - 15%
- Latter-Day Saints (Mormon) - 4%
- Judaism - 1.6%
- Others - 11%
L. Ron Hubbard, the founder of Scientology, lived in Phoenix during Scientology's formative years and thus Arizona has been labeled the "Birthplace of Scientology."[12]
According to the Association of Religion Data Archives,[13] the ten largest denominations by number of adherents in 2000 were:
Catholic Church 974,883 The Church of Jesus Christ of Latter-day Saints 251,974 Southern Baptist Convention 138,516 Assemblies of God 82,802 Judaism (Estimated) 81,675 Evangelical Lutheran Church in America 69,393 United Methodist Church 53,232 Independent, Non-Charismatic Churches Evangelical Protestant 34,130 Presbyterian Church (U.S.A.) 33,554 Christian Churches and Churches of Christ 33,162 Other
In 2010, there were an estimated 460,000 illegal immigrants in the state.[14] These constituted an estimated 7.9% of the population.[15]
References
- ^ Resident Population Data - 2010 Census
- ^ "Table 1: Estimates of Population Change for the United States and States, and for Puerto Rico and State Rankings: July 1, 2005 to July 1, 2006". 2006 Population Estimates. U.S. Census Bureau, Population Division. December 22, 2006. Archived from the original on January 10, 2007. http://web.archive.org/web/20070110093142/http://www.census.gov/Press-Release/www/2006/statepopest_table1.xls. Retrieved December 22, 2006.
- ^ Title=The New York Times 2008 Almanac|Author=edited by John W. Wright|Date=2007|Page=178
- ^ "Population and Population Centers by State - 2000". United States Census Bureau. http://www.census.gov/geo/www/cenpop/statecenters.txt. Retrieved 2008-12-04.
- ^ Arizona - Fact Sheet - American FactFinder
- ^ Arizona - ACS Demographic and Housing Estimates: 2005-2007
- ^ Arizona QuickFacts from the US Census Bureau
- ^ a b Arizona - Selected Social Characteristics in the United States: 2005-2007
- ^ Being Black in the Valley
- ^ American FactFinder - Results
- ^ Pew Forum on Religion and Life Religious composition of Arizona residents, 2008. Margin of Error +/-4.5%
- ^ Church of Scientology of Arizona
- ^ The Association of Religion Data Archives | Maps & Reports
- ^ Chapman, Steve (23 April 2010). "How immigration crackdowns backfire". Washington, DC: Washington Examiner. pp. 31. http://www.washingtonexaminer.com/opinion/columns/How-immigration-crackdowns-backfire-91842259.html.
- ^ Slevin, Peter (30 April 2010). "New Arizona law puts police in 'tenuous' spot". Washington, DC: Washington Post. pp. A4. http://www.washingtonpost.com/wp-dyn/content/article/2010/04/29/AR2010042904970.html?sid=ST2010042905051.
External links
- 2000 Census of Population and Housing for Arizona, U.S. Census Bureau
 State of Arizona
Phoenix (capital) Topics Index | Climate | Delegations | Geography | History | Museums | Music | People | Transportation | Visitor Attractions
Society Culture · Demographics · Economy · Education · Politics
Regions Arizona Strip | Arizona Sun Corridor | Coconino Plateau | Colorado Plateau | Grand Canyon | Kaibab Plateau | Mogollon Plateau | Mogollon Rim | Mojave Desert | Monument Valley | North Central Arizona | Northeast Arizona | Northern Arizona | Oak Creek Canyon | Phoenix Metropolitan Area | Safford area | San Francisco Volcanic Field | Sonoran Desert | Southern Arizona | Verde Valley | White Mountains
Counties Cities Chandler | Flagstaff | Gilbert | Glendale | Kingman | Lake Havasu City | Mesa | Peoria | Phoenix | Prescott | Scottsdale | Sierra Vista | Tempe | Tucson | Yuma
Demographics of the United States by state Demographics by state Alabama • Alaska • Arizona • Arkansas • California • Colorado • Connecticut • Delaware • Florida • Georgia • Hawaii • Idaho • Illinois • Indiana • Iowa • Kansas • Kentucky • Louisiana • Maine • Maryland • Massachusetts • Michigan • Minnesota • Mississippi • Missouri • Montana • Nebraska • Nevada • New Hampshire • New Jersey • New Mexico • New York • North Carolina • North Dakota • Ohio • Oklahoma • Oregon • Pennsylvania • Rhode Island • South Carolina • South Dakota • Tennessee • Texas • Utah • Vermont • Virginia • Washington • West Virginia • Wisconsin • WyomingFederal district Demographics by city Categories:- Demographics of Arizona
- Economy of Arizona
Wikimedia Foundation. 2010.