Summary statistic

Summary statistic
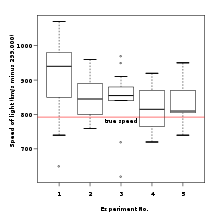
Box plot of the Michelson–Morley experiment, showing several summary statistics.

In descriptive statistics, summary statistics are used to summarize a set of observations, in order to communicate the largest amount as simply as possible. Statisticians commonly try to describe the observations in

A common collection of order statistics used as summary statistics are the five-number summary, sometimes extended to a seven-number summary, and the associated box plot.

Entries in an analysis of variance table can also be regarded as summary statistics.[1]

Contents

Example

The following example using R is the standard summary statistics of a randomly sampled normal distribution, with a mean of 0, standard deviation of 1, and a population of 50:

> x <- rnorm(n=50, mean=0, sd=1)
> summary(x)
    Min.  1st Qu.   Median     Mean  3rd Qu.     Max. 
-1.72700 -0.49650 -0.05157  0.07981  0.67640  2.46700

Examples of summary statistics

Location

Common measures of location, or central tendency, are the arithmetic mean, median, mode, and interquartile mean.

Spread

Common measures of statistical dispersion are the standard deviation, variance, range, interquartile range, absolute deviation and the distance standard deviation. Measures that assess spread in comparison to the typical size of data values include the coefficient of variation.

The Gini coefficient was originally developed to measure income inequality and is equivalent to one of the L-moments.

Shape

Common measures of the shape of a distribution are skewness or kurtosis, while alternatives can be based on L-moments. A different measure is the Distance skewness, for which a value of zero implies central symmetry.

Percentiles

A simple summary of a dataset is sometimes given by quoting particular order statistics as approximations to selected percentiles of a distribution.

Dependence

The common measure of dependence between paired random variables is the Pearson product-moment correlation coefficient, while a common alternative summary statistic is Spearman's rank correlation coefficient. Distance correlation equals zero implies independence.

See also

References

  1. ^ Upton, G., Cook, I. (2006). Oxford Dictionary of Statistics, OUP. ISBN 978-0-19-954145-4

Wikimedia Foundation. 2010.

Игры ⚽ Поможем написать реферат

Look at other dictionaries:

  • Summary statistics — In descriptive statistics, summary statistics are used to summarize a set of observations, in order to communicate as much as possible as simply as possible. Statisticians commonly try to describe the observations in # a measure of location, or… …   Wikipedia

  • Order statistic — Probability distributions for the n = 5 order statistics of an exponential distribution with θ = 3 In statistics, the kth order statistic of a statistical sample is equal to its kth smallest value. Together with rank statistics, order statistics… …   Wikipedia

  • PRESS statistic — In statistics, the predicted residual sums of squares (PRESS) statistic is used in regression analysis to provide a summary measure of the fit of a model to a sample of observations. These observation were not themselves used to estimate the… …   Wikipedia

  • Five-number summary — In descriptive statistics, the five number summary of a data set consists of:# the minimum (smallest observation) # the lower quartile or first quartile (which cuts off the lowest 25% of the data) # the median (middle value) # the upper quartile… …   Wikipedia

  • Optimal design — This article is about the topic in the design of experiments. For the topic in optimal control theory, see shape optimization. Gustav Elfving developed the optimal design of experiments, and so minimized surveyors need for theodolite measurements …   Wikipedia

  • Absolute deviation — In statistics, the absolute deviation of an element of a data set is the absolute difference between that element and a given point. Typically the point from which the deviation is measured is a measure of central tendency, most often the median… …   Wikipedia

  • Bond credit rating — In investment, the bond credit rating assesses the credit worthiness of a corporation s or government debt issues. It is analogous to credit ratings for individuals. Contents 1 Table 2 Credit rating agencies 3 Credit rating tiers …   Wikipedia

  • Correlation and dependence — This article is about correlation and dependence in statistical data. For other uses, see correlation (disambiguation). In statistics, dependence refers to any statistical relationship between two random variables or two sets of data. Correlation …   Wikipedia

  • Receiver operating characteristic — In signal detection theory, a receiver operating characteristic (ROC), or simply ROC curve, is a graphical plot of the sensitivity vs. (1 specificity) for a binary classifier system as its discrimination threshold is varied. The ROC can also be… …   Wikipedia

  • Correlation — In probability theory and statistics, correlation, (often measured as a correlation coefficient), indicates the strength and direction of a linear relationship between two random variables. In general statistical usage, correlation or co relation …   Wikipedia

Share the article and excerpts

Direct link
Do a right-click on the link above
and select “Copy Link”