- Web mapping
-
Web mapping is the process of designing, implementing, generating and delivering maps on the World Wide Web and its product. While web mapping primarily deals with technological issues, web cartography additionally studies theoretic aspects: the use of web maps, the evaluation and optimization of techniques and workflows, the usability of web maps, social aspects, and more. Web GIS is similar to web mapping but with an emphasis on analysis, processing of project specific geodata and exploratory aspects[1]. Often the terms web GIS and web mapping are used synonymously, even if they don't mean exactly the same. In fact, the border between web maps and web GIS is blurry. Web maps are often a presentation media in web GIS and web maps are increasingly gaining analytical capabilities.
A special case of web maps are mobile maps, displayed on mobile computing devices, such as mobile phones, smart phones, PDAs and GPS. If the maps on these devices are displayed by a mobile web browser or web user agent, they can be regarded as mobile web maps. If the mobile web maps also display context and location sensitive information, such as points of interest, the term Location-based services is frequently used."[2]
"The use of the web as a dissemination medium for maps can be regarded as a major advancement in cartography and opens many new opportunities, such as realtime maps, cheaper dissemination, more frequent and cheaper updates of data and software, personalized map content, distributed data sources and sharing of geographic information. It also implicates many challenges due to technical restrictions (low display resolution and limited bandwidth, in particular with mobile computing devices, many of which are physically small, and use slow wireless Internet connections), copyright[3] and security issues, reliability issues and technical complexity. While the first web maps were primarily static, due to technical restrictions, today's web maps can be fully interactive and integrate multiple media. This means that both web mapping and web cartography also have to deal with interactivity, usability and multimedia issues."[4]
A more general term is neogeography.
Development and implementation
The advent of web mapping can be regarded as a major new trend in cartography. Previously, cartography was restricted to a few companies, institutes and mapping agencies, requiring expensive and complex hardware and software as well as skilled cartographers and geomatics engineers. With web mapping, freely available mapping technologies and geodata potentially allow every skilled person to produce web maps, with expensive geodata and technical complexity (data harmonization, missing standards) being two of the remaining barriers preventing web mapping from fully going mainstream. The cheap and easy transfer of geodata across the internet allows the integration of distributed data sources, opening opportunities that go beyond the possibilities of disjoint data storage. Everyone with minimal knowhow and infrastructure can become a geodata provider. These facts can be regarded both as an advantage and a disadvantage. While it allows everyone to produce maps and considerably enlarges the audience, it also puts geodata in the hands of untrained people who potentially violate cartographic and geographic principles and introduce flaws during the preparation, analysis and presentation of geographic and cartographic data.
Types of web maps
A first classification of web maps has been made by Kraak.[5] He distinguished static and dynamic web maps and further distinguished interactive and view only web maps. However, today in the light of an increased number of different web map types, this classification needs some revision. Today, there are additional possibilities regarding distributed data sources, collaborative maps, personalized maps, etc.
Analytic web maps
These web maps offer GIS analysis, either with geodata provided, or with geodata uploaded by the map user. As already mentioned, the borderline between analytic web maps and web GIS is blurry. Often, parts of the analysis are carried out by a serverside GIS and the client displays the result of the analysis. As web clients gain more and more capabilities, this task sharing may gradually shift.
Animated web maps
Animated Maps show changes in the map over time by animating one of the graphical or temporal variables. Various data and multimedia formats and technologies allow the display of animated web maps: SVG, Adobe Flash, Java, Quicktime, etc., also with varying degrees of interaction. Examples for animated web maps are weather maps, maps displaying dynamic natural or other phenomena (such as water currents, wind patterns, traffic flow, trade flow, communication patterns,social studies projects, and for college life, etc.).
Collaborative web maps
Main article: Collaborative mappingCollaborative maps are still new, immature and complex to implement, but show a lot of potential. The method parallels the Wikipedia project where various people collaborate to create and improve maps on the web. Technically, an application allowing simultaneous editing across the web would have to ensure that geometric features being edited by one person are locked, so they can't be edited by other persons at the same time. Also, a minimal quality check would have to be made, before data goes public. Some collaborative map projects:
- Google Map Maker
- OpenStreetMap
- WikiMapia
- meta:Maps - survey of Wikimedia map proposals on Wikipedia:Meta
- (Please add additional notes, references and examples here!)
Customisable web maps
Web maps in this category are usually more complex web mapping systems that offer APIs for reuse in other people's web pages and products. Example for such a system with an API for reuse are the Open Layers Framework, Yahoo! Maps, Google Maps and Streetmaps.co.za.
Distributed web maps
These are maps created from a distributed data source. The WMS protocol offers a standardised method to access maps on other servers. WMS servers can collect these different sources, reproject the map layers, if necessary, and send them back as a combined image containing all requested map layers. One server may offer a topographic base map, while other servers may offer thematic layers.
Dynamically created web maps
These maps are created on demand each time the user reloads the webpages, often from dynamic data sources, such as databases. The webserver generates the map using a web map server or a self written software. Some applications refer to depictions as hyper maps. One of the example is- Bhoosampada by Indian Space Research Organizations.
Hyper Maps
Any approach offering the planar presentation of a portion of an n-dimensional orthogonal web map structure with the option to chose the axes for depiction from the dimensions.
Interactive web maps
Interactivity is one of the major advantages of screen based maps and web maps. It helps to compensate for the disadvantages of screen and web maps. Interactivity helps to explore maps, change map parameters, navigate and interact with the map, reveal additional information, link to other resources, and much more. Technically, it is achieved through the combination of events, scripting and DOM manipulations. See section on Client Side Technologies.
Online atlases
Atlas projects often went through a renaissance when they made a transition to a web based project. In the past, atlas projects often suffered from expensive map production, small circulation and limited audience. Updates were expensive to produce and took a long time until they hit the public. Many atlas projects, after moving to the web, can now reach a wider audience, produce cheaper, provide a larger number of maps and map types and integrate with and benefit from other web resources. Some atlases even ceased their printed editions after going online, sometimes offering printing on demand features from the online edition. Some atlases (primarily from North America) also offer raw data downloads of the underlying geospatial data sources.
Personalized web maps
Personalized web maps allow the map user to apply his own data filtering, selective content and the application of personal styling and map symbolization. The OGC (Open Geospatial Consortium) provides the SLD standard (Styled Layer Description) that may be sent to a WMS server for the application of individual styles. This implies that the content and data structure of the remote WMS server is properly documented.
Realtime web maps
Realtime maps show the situation of a phenomenon in close to realtime (only a few seconds or minutes delay). Data is collected by sensors and the maps are generated or updated at regular intervals or immediately on demand. Examples are weather maps, traffic maps or vehicle monitoring systems.
Static web maps
 A USGS DRG - a static map
Static web pages are view only with no animation and interactivity. They are only created once, often manually and infrequently updated. Typical graphics formats for static web maps are PNG, JPEG, GIF, or TIFF (e.g., drg) for raster files, SVG, PDF or SWF for vector files. Often, these maps are scanned paper maps and had not been designed as screen maps. Paper maps have a much higher resolution and information density than typical computer displays of the same physical size, and might be unreadable when displayed on screens at the wrong resolution.[5]
Temporal web maps
Any depiction of a portion of an n-dimensional orthogonal web map structure in a planar projection with time as one of the coordinate axes.
Advantages of web maps
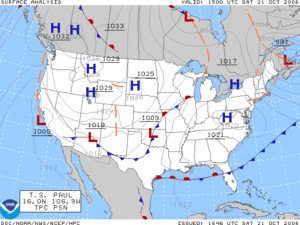 A surface weather analysis for the United States on October 21, 2006.
- Web maps can easily deliver up to date information. If maps are generated automatically from databases, they can display information in almost realtime. They don't need to be printed, mastered and distributed. Examples:
- A map displaying election results, as soon as the election results become available.
- A map displaying the traffic situation near realtime by using traffic data collected by sensor networks.
- A map showing the current locations of mass transit vehicles such as buses or trains, allowing patrons to minimize their waiting time at stops or stations, or be aware of delays in service.
- Weather maps, such as NEXRAD.
- Software and hardware infrastructure for web maps is cheap. Web server hardware is cheaply available and many open source tools exist for producing web maps.
- Product updates can easily be distributed. Because web maps distribute both logic and data with each request or loading, product updates can happen every time the web user reloads the application. In traditional cartography, when dealing with printed maps or interactive maps distributed on offline media (CD, DVD, etc.), a map update caused serious efforts, triggering a reprint or remastering as well as a redistribution of the media. With web maps, data and product updates are easier, cheaper, and faster, and can occur more often.
- They work across browsers and operating systems. If web maps are implemented based on open standards, the underlying operating system and browser do not matter.
- Web maps can combine distributed data sources. Using open standards and documented APIs one can integrate (mash up) different data sources, if the projection system, map scale and data quality match. The use of centralized data sources removes the burden for individual organizations to maintain copies of the same data sets. The downside is that one has to rely on and trust the external data sources.
- Web maps allow for personalization. By using user profiles, personal filters and personal styling and symbolization, users can configure and design their own maps, if the web mapping systems supports personalization. Accessibility issues can be treated in the same way. If users can store their favourite colors and patterns they can avoid color combinations they can't easily distinguish (e.g. due to color blindness).
- Web maps enable collaborative mapping. Similar to the Wikipedia project, web mapping technologies, such as DHTML/Ajax, SVG, Java, Adobe Flash, etc. enable distributed data acquisition and collaborative efforts. Examples for such projects are the OpenStreetMap project or the Google Earth community. As with other open projects, quality assurance is very important, however!
- Web maps support hyperlinking to other information on the web. Just like any other web page or a wiki, web maps can act like an index to other information on the web. Any sensitive area in a map, a label text, etc. can provide hyperlinks to additional information. As an example a map showing public transport options can directly link to the corresponding section in the online train time table.
- It is easy to integrate multimedia in and with web maps. Current web browsers support the playback of video, audio and animation (SVG, SWF, Quicktime, and other multimedia frameworks).
Disadvantages of web maps and problematic issues
- Reliability issues – the reliability of the internet and web server infrastructure is not yet good enough. Especially if a web map relies on external, distributed data sources, the original author often cannot guarantee the availability of the information.
- Geodata is expensive – Unlike in the US, where geodata collected by governmental institutions is usually available for free or cheap, geodata is usually very expensive in Europe or other parts of the world.
- Bandwidth issues – Web maps usually need a relatively high bandwidth.
-
Limited screen space – Like with other screen based maps, web maps have the problem of limited screen space. This is in particular a problem for mobile web maps and location based services where maps have to be displayed in very small screens with resolutions as low as 100×100 pixels. Hopefully, technological advances will help to overcome these limitations.
- Quality and accuracy issues – Many web maps are of poor quality, both in symbolization, content and data accuracy.
- Complex to develop – Despite the increasing availability of free and commercial tools to create web mapping and web GIS applications, it is still a complex task to create interactive web maps. Many technologies, modules, services and data sources have to be mastered and integrated.
- Immature development tools – Compared to the development of standalone applications with integrated development tools, the development and debugging environments of a conglomerate of different web technologies is still awkward and uncomfortable.
- Copyright issues – Many people are still reluctant to publish geodata, especially in the light that geodata is expensive in some parts of the world. They fear copyright infringements of other people using their data without proper requests for permission.
- Privacy issues – With detailed information available and the combination of distributed data sources, it is possible to find out and combine a lot of private and personal information of individual persons. Properties and estates of individuals are now accessible through high resolution aerial and satellite images throughout the world to anyone.
History of web mapping
Event types - Cartography-related events
- Technical events directly related to web mapping
- General technical events
- Events relating to Web standards
This section contains some of the milestones of web mapping, online mapping services and atlases. Because web mapping depends on enabling technologies of the web, this section also includes a few milestones of the web.[6]
- 1989-90: Birth of the WWW, WWW invented at CERN for the exchange of research documents.[7]
- 1990-12: First Web Browser and Web Server, Tim Berners-Lee wrote first web browser[8] and web server.
- 1991-04: HTTP 0.9[9] protocol, Initial design of the HTTP protocol for communication between browser and server.
- 1991-06: ViolaWWW 0.8 Browser, The first popular web browser. Written for X11 on Unix.
- 1991-08: WWW project announced in public newsgroup, This is regarded as the debut date of the Web. Announced in newsgroup alt.hypertext.
- 1992-06: HTTP 1.0[9] protocol, Version 1.0 of the HTTP protocol. Introduces the POST method and persistent connections.
- 1993-04: CERN announced web as free, CERN announced that access to the web will be free for all.[10] The web gained critical mass.
- 1993-06: HTML 1.0.[11] The first version of HTML,[12] published by T. Berners-Lee and Dan Connolly.
- 1993-07: Xerox PARC Map Viewer, The first mapserver based on CGI/Perl, allowed reprojection styling and definition of map extent.
- 1994: The World Wide Earthquake Locator, the first interactive web mapping mashup was released, based on the Xerox PARC map view.
- 1994-06: The National Atlas of Canada, The first version of the National Atlas of Canada was released. Can be regarded as the first online atlas.
- 1994-10: Netscape Browser 0.9 (Mosaic), The first version of the highly popular browser Netscape Navigator.
- 1995: The Gazetteer for Scotland, The prototype version of the Gazetteer for Scotland was released. The first geographical database with interactive mapping.
- 1995-03: Java 1.0, The first public version of Java.
- 1995-11: HTML 2.0,[11] Introduced forms, file upload, internationalization and client-side image maps.
- 1995-12: Javascript 1.0, Introduced first script based interactivity.
- 1995: MapGuide, First introduced as Argus MapGuide.
- 1996-01: JDK 1.0, First version of the Sun JDK.
- 1996-02: Mapquest, The first popular online Address Matching and Routing Service with mapping output.
- 1996-06: MultiMap, The UK-based MultiMap website launched offering online mapping, routing and location based services. Grew into one of the most popular UK web sites.
- 1996-11: Geomedia WebMap 1.0, First version of Geomedia WebMap, already supports vector graphics through the use of ActiveCGM.[13]
- 1996-fall: MapGuide, Autodesk acquired Argus Technologies.and introduced Autodesk MapGuide 2.0.
- 1996-12: Macromedia Flash 1.0, First version of the Macromedia Flash plugin.
- 1997-01: HTML 3.2,[11] Introduced tables, applets, script elements, multimedia elements, flowtext around images, etc.
 National Atlas of the United States logo
- 1997-03:Norwegian company Mapnet launches application for www.epi.no with active POI layer for real estate listings.
- 1997-06: US Online National Atlas Initiative, The USGS received the mandate to coordinate and create the online National Atlas of the United States of America [2].
- 1997-07: UMN MapServer 1.0, Developed as Part of the NASA ForNet Project. Grew out of the need to deliver remote sensing data across the web for foresters.
- 1997-12: HTML 4.0,[11] Introduced styling with CSS, absolute and relative positioning of elements, frames, object element, etc.
- 1998-06: Terraserver USA, A Web Map Service serving aerial images (mainly b+w) and USGS DRGs was released. One of the first popular WMS. This service is a joint effort of USGS, Microsoft and HP.
- 1998-07: UMN MapServer 2.0, Added reprojection support (PROJ.4).
- 1998-08: MapObjects Internet Map Server, ESRI's entry into the web mapping business.
- 1999-03: HTTP 1.1[9] protocol, Version 1.1 of the HTTP protocol. Introduces the request pipelining for multiple connections between server and client. This version is still in use as of 2007.
- 1999-08: National Atlas of Canada, 6th edition, This new version was launched at the ICA 1999 conference in Ottawa. Introduced many new features and topics. Is being improved gradually, since then, and kept up-to-date with technical advancements.
- 2000-02: ArcIMS 3.0, The first public release of ESRI's ArcIMS.
- 2000-06: ESRI Geography Network, ESRI founded Geography Network to distribute data and web map services.
- 2000-06: UMN MapServer 3.0, Developed as part of the NASA TerraSIP Project. This is also the first public, open source release of UMN Mapserver. Added raster support and support for TrueType fonts (FreeType).
- 2000-08: Flash Player 5, This introduced ActionScript 1.0 (ECMAScript compatible).
- 2001-06: MapScript [3] 1.0 for UMN MapServer, Adds a lot of flexibility to UMN MapServer solutions.
- 2001-09: SVG 1.0[14] W3C Recommendation, SVG (Scalable Vector Graphics) 1.0 became a W3C Recommendation.
- 2001-09: Tirolatlas, A highly interactive online atlas, the first to be based on the SVG standard.
- 2002-06: UMN MapServer 3.5, Added support for PostGIS and ArcSDE. Version 3.6 adds initial OGC WMS support.
- 2002-07: ArcIMS 4.0, Version 4 of the ArcIMS web map server.
- 2003-01: SVG 1.1[14] W3C Recommendation, SVG 1.1 became a W3C Recommendation. This introduced the mobile profiles SVG Tiny[14] and SVG Basic.[14]
 Screenshot from NASA World Wind
- 2003-06: NASA World Wind, NASA World Wind Released. An open virtual globe that loads data from distributed resources across the internet. Terrain and buildings can be viewed 3 dimensionally. The (XML based) markup language allows users to integrate their own personal content. This virtual globe needs special software and doesn't run in a web browser.
- 2003-07: UMN MapServer 4.0, Adds 24bit raster output support and support for PDF and SWF.
- 2003-09: Flash Player 7, This introduced ActionScript 2.0 (ECMAScript 2.0 compatible (improved object orientation)). Also initial Video Playback support.
- 2004-07: OpenStreetMap was founded by Steve Coast. OSM is a web based collaborative project to create a world map under a free license.
- 2005-01: Nikolas Schiller creates the interactive "Inaugural Map"[15] of downtown Washington, DC
- 2005-02: Google Maps, The first version of Google Maps. Based on raster tiles organized in a quad tree scheme, data loading done with XMLHttpRequests. This mapping application became highly popular on the web, also because it allowed other people to integrate google map services into their own website.
- 2005-04: UMN MapServer 4.6, Adds support for SVG.
- 2005-06: Google Earth, The first version of Google Earth was released building on the virtual globe metaphor. Terrain and buildings can be viewed 3 dimensionally. The KML (XML based) markup language allows users to integrate their own personal content. This virtual globe needs special software and doesn't run in a web browser.
- 2005-11: Firefox 1.5, First Firefox release with native SVG support. Supports Scripting but no animation.
- 2006-05: Wikimapia Launched
- 2006-06: Opera 9, Opera releases version 9 with extensive SVG support (including scripting and animation).
- 2006-08: SVG 1.2[14] Mobile Candidate Recommendation, This SVG Mobile Profile introduces improved multimedia support and many features required to build online Rich Internet Applications.
- 2009-01 Nokia makes Ovi Maps free on its smartphones.
Web mapping technologies
The potential number of technologies to implement web mapping projects is almost infinite. Any programming environment, programming language and serverside framework can be used to implement web mapping projects. In any case, both server and client side technologies have to be used. Following is a list of potential and popular server and client side technologies utilized for web mapping.
Server side technologies
- Web server – The webserver is responsible for handling http requests by web browsers and other user agents. In the simplest case they serve static files, such as HTML pages or static image files. Web servers also handle authentication, content negotiation, server side includes, URL rewriting and forward requests to dynamic resources, such as CGI applications or serverside scripting languages. The functionality of a webserver can usually be enhanced using modules or extensions. The most popular web server is Apache, followed by Microsoft Internet Information Server and others.
- CGI (common gateway interface) applications are executables running on the webserver under the environment and user permissions of the webserver user. They may be written in any programming language (compiled) or scripting language (e.g. perl). A CGI application implements the common gateway interface protocol, processes the information sent by the client, does whatever the application should do and sends the result back in a web-readable form to the client. As an example a web browser may send a request to a CGI application for getting a web map with a certain map extent, styling and map layer combination. The result is an image format, e.g. JPEG, PNG or SVG. For performance enhancements one can also install CGI applications such as FastCGI. This loads the application after the web server is started and keeps the application in memory, eliminating the need to spawn a separate process each time a request is being made.
- Alternatively, one can use scripting languages built into the webserver as a module, such as PHP, Perl, Python, ASP, Ruby, etc. If built into the web server as a module, the scripting engine is already loaded and doesn't have to be loaded each time a request is being made.
- Web application servers are middleware which connects various software components with the web server and a programming language. As an example, a web application server can enable the communication between the API of a GIS and the webserver, a spatial database or other proprietary applications. Typical web application servers are written in Java, C, C++, C# or other scripting languages. Web application servers are also useful when developing complex realtime web mapping applications or Web GIS.
- Spatial databases are usually object relational databases enhanced with geographic data types, methods and properties. They are necessary whenever a web mapping application has to deal with dynamic data (that changes frequently) or with huge amount of geographic data. Spatial databases allow spatial queries, sub selects, reprojections, geometry manipulations and offer various import and export formats. A popular example for an open source spatial database is PostGIS. MySQL also implements some spatial features, although not as mature as PostGIS. Commercial alternatives are Oracle Spatial or spatial extensions of Microsoft SQL Server and IBM DB2. The OGC Simple Features for SQL Specification is a standard geometry data model and operator set for spatial databases. Most spatial databases implement this OGC standard.
- WMS server are specialized web mapping servers implemented as a CGI application, Java Servlet or other web application server. They either work as a standalone web server or in collaboration with existing web servers or web application servers (the general case). WMS Servers can generate maps on request, using parameters, such as map layer order, styling/symbolization, map extent, data format, projection, etc. The OGC Consortium defined the WMS standard to define the map requests and return data formats. Typical image formats for the map result are PNG, JPEG, GIF or SVG. There are open source WMS Servers such as UMN Mapserver and Mapnik. Commercial alternatives exist from most commercial GIS vendors, such as ESRI ArcIMS, ArcGIS Server, GeoClip[16], Intergraph Geomedia WebMap, and others.
Client side technologies
- Web browser – In the simplest setup, only a web browser is required. All modern web browsers support the display of HTML and raster images (JPEG, PNG and GIF format). Some solutions require additional plugins (see below).
- ECMAScript support – ECMAScript is the standardized version of JavaScript. It is necessary to implement client side interaction, refactoring of the DOM of a webpage and for doing network requests. ECMAScript is currently part of any modern web browser.
- Events support – Various events are necessary to implement interactive client side maps. Events can trigger script execution or SMIL operations. We distinguish between:
- Mouse events (mousedown, mouseup, mouseover, mousemove, click)
- Keyboard events (keydown, keypress, keyup)
- State events (load, unload, abort, error)
- Mutation events (reacts on modifications of the DOM tree, e.g. DOMNodeInserted)
- SMIL animation events (reacts on different states in SMIL animation, beginEvent, endEvent, repeatEvent)
- UI events (focusin, focusout, activate)
- SVG specific events (SVGZoom, SVGScroll, SVGResize)
- Network requests – This is necessary to load additional data and content into a web page. Most modern browsers provide the XMLHttpRequest object which allows for get and post http requests and provides some feedback on the data loading state. The data received can be processed by ECMAScript and can be included into the current DOM tree of the web page / web map. SVG user agents alternatively provide the getURL() and postURL() methods for network requests. It is recommended to test for the existence of a network request method and provide alternatives if one method isn't present. As an example, a wrapper function could handle the network requests and test whether XMLHttpRequests or getURL() or alternative methods are available and choose the best one available. These network requests are also known under the term Ajax.
- DOM support – The Document Object Model provides a language independent API for the manipulation of the document tree of the webpage. It exposes properties of the individual nodes of the document tree, allows to insert new nodes, delete nodes, reorder nodes and change existing nodes. DOM support is included in any modern web browser. DOM support together with scripting is also known as DHTML or Dynamic HTML. Google Maps and many other web mapping sites use a combination of DHTML, Ajax, SVG and VML.
- SVG support or SVG image support – SVG is the abbreviation of "Scalable Vector Graphics" and integrates vector graphics, raster graphics and text. SVG also supports animation, internationalization, interactivity, scripting and XML based extension mechanisms. SVG is a huge step forward when it comes to delivering high quality, interactive maps. At the time of writing (2007–01), SVG is natively supported in Mozilla/Firefox >version 1.5, Opera >version 9 and the developer version of Safari/Webkit. Internet Explorer users still need the Adobe SVG viewer plugin provided by Adobe. For a German book on web mapping with SVG see[17] and for an English paper on SVG mapping see.[18]
- Java support – some browsers still provide old versions of the Java virtual machine. An alternative is the use of the Sun Java Plugin. Java is a full featured programming language that can be used to create very sophisticated and interactive web maps. The Java2D and Java3D libraries provide 2d and 3d vector graphics support. The creation of Java based web maps requires a lot of programming know how. Adrian Herzog[19] discusses the use of Java applets for the presentation of interactive choroplethe and cartogram maps.
- Web browser plugins
- Adobe Acrobat – provides vector graphics and high quality printing support. Allows toggling of map layers, hyper links, multimedia embedding, some basic interactivity and scripting (ECMAScript).
- Adobe Flash – provides vector graphics, animation and multimedia support. Allows the creation of sophisticated interactive maps, as with Java and SVG. Features a programming language (ActionScript) which is similar to ECMAScript. Supports Audio and Video.
- Apple Quicktime – Adds support for additional image formats, video, audio and Quicktime VR (Panorama Images). Only available to Mac OS X and Windows.
- Adobe SVG viewer – provide SVG 1.0 support for web browsers, only required for Internet Explorer Users, because it doesn't yet natively support SVG. The Adobe SVG viewer isn't developed any further and only fills the gap until Internet Explorer gains native SVG support.
- Sun Java plugin provides support for newer and advanced Java Features.
See also
- Comparison of web map services
- Geographic Information Systems (GIS)
- List of online map services
- Neogeography
- Participatory GIS (PGIS)
- Public Participation GIS (PPGIS)
- Soundmap
- Volunteered Geographic Information (VGI)
Notes and references
- ^ Fu, P., and J. Sun. 2010. Web GIS: Principles and Applications. ESRI Press. Redlands, CA. ISBN 158948245X.
- ^ Andreas Neumann Encyclopedia of GIS pg 1261
- ^ See Trap street for examples of how map vendors trap copyright violators, by introducing deliberate errors into their maps.
- ^ Andreas Neumann in Encyclopedia of GIS, Springer, 2007. pg 1262
- ^ a b Kraak, Menno Jan (2001): Settings and needs for web cartography, in: Kraak and Allan Brown (eds), Web Cartography, Francis and Taylor, New York, p. 3–4. see also webpage [1]. Accessed 2007-01-04.
- ^ For much more detail, see History of the World Wide Web and related topics under History of computer hardware.
- ^ More details are in: History of the World Wide Web#1980–91: Development of the WWW.
- ^ For a list of early Web browsers, see: List of web browsers#Historical.
- ^ a b c For the version history of HTTP, see: HTTP#HTTP versions.
- ^ For more details on CERN's decision to give away early web technology, see: History of the World Wide Web#Web organization.
- ^ a b c d For the version history of HTML, see: HTML#Version history of the standard.
- ^ See HTML#History.
- ^ ActiveCGM is evidently an ActiveX control that displays CGM files.[citation needed]
- ^ a b c d e See: SVG format#Development history
- ^ David Montgomery (2007-03-14). "Here Be Dragons". News (Washington Post). http://www.washingtonpost.com/wp-dyn/content/article/2007/03/13/AR2007031301854.html. Retrieved 2007-03-14.
- ^ http://www.geoclip.net
- ^ Überschär, Nicole and André M. Winter (2006): Visualisieren von Geodaten mit SVG im Internet, Band 1: Scalable Vector Graphics – Einführung, clientseitige Interaktionen und Dynamik, Wichmann Verlag, Heidelberg, ISBN 3-87907-431-3.
- ^ Neumann, Andreas and André M. Winter (2003): Webmapping with Scalable Vector Graphics (SVG): Delivering the promise of high quality and interactive web maps, in: Peterson, M. (ed.), Maps and the Internet, Elsevier, p. 197–220.
- ^ Herzog, Adrian (2003):Developing Cartographic Applets for the Internet, in: Peterson, M. (ed.) Maps and the Internet, Elsevier, p. 117–130.
Further reading
- Fu, P., and J. Sun. 2010. Web GIS: Principles and Applications. ESRI Press. Redlands, CA. ISBN 158948245X.
- Graham, M. 2010. Neogeography and the Palimpsests of Place. Tijdschrift voor Economische en Sociale Geografie. 101(4), 422-436.
- Kraak, Menno-Jan and Allan Brown (2001): Web Cartography – Developments and prospects, Taylor & Francis, New York, ISBN 0-7484-0869-X.
- Mitchel, Tyler (2005): WebMapping Illustrated, O'Reilly, Sebastopol, 350 pages, ISBN 0-569-00865-1. This book discusses various Open Source WebMapping projects and provides hints and tricks as well as examples.
- Peterson, Michael P. (ed.) (2003): Maps and the Internet, Elsevier, ISBN 0-08-044201-3.
- Rambaldi G, Chambers R., McCall M, And Fox J. 2006. Practical ethics for PGIS practitioners, facilitators, technology intermediaries and researchers. PLA 54:106-113, IIED, London, UK
External links
Sites
Networks
- Open Forum on Participatory Geographic Information Systems and Technologies - a global network of PGIS/PPGIS practitioners with Spanish, Portuguese and French-speaking chapters.
- Geowanking
Categories:


Wikimedia Foundation. 2010.