- Comparison between U.S. states and countries by GDP (nominal) per capita
-
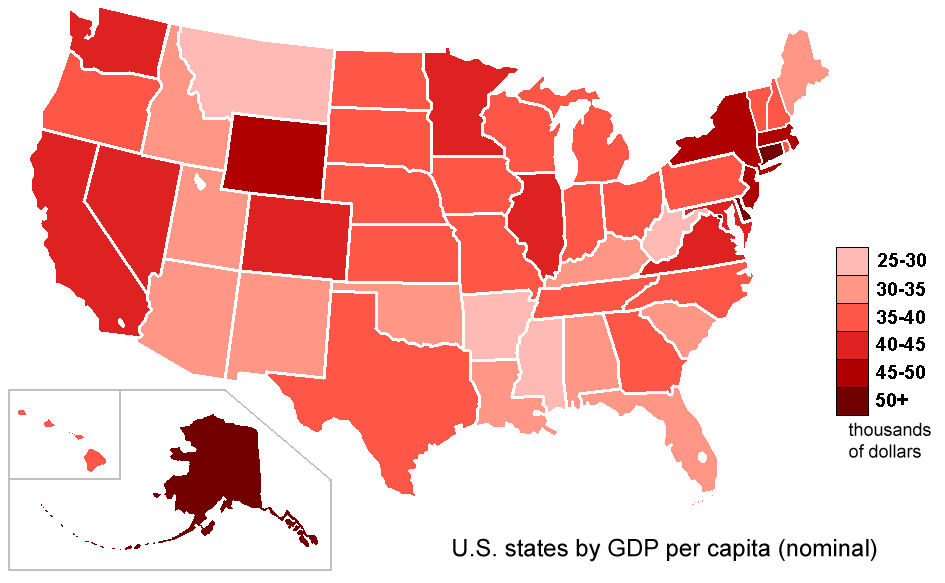
 Per capita GDP by state
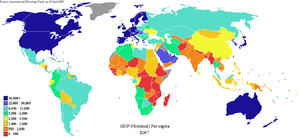 Map of countries by 2007 GDP (nominal) per capita (IMF, April 2008).
This is a comparison between US states and countries' per capita nominal Gross Domestic Product. These figures are based on the International Monetary Fund list on List of countries by GDP (nominal) per capita for world GDP, and the List of U.S. states by GDP per capita (nominal) figures.
The US is not counted as a whole in the overall rank because this would be double counting since the states of the US are being compared to other countries. These figures are calculated using exchange rate conversions, and exchange rates fluctuate from year to year.
2009
IMF list Overall Rank Rank by country/Rank by US State Country/US State GDP per capita (USD) - — World 8,241 - — European Union 33,889 - - United States of America 45,725 1 1 District of Columbia 124,363 2 1 Luxembourg 103,125 3 2 Norway 83,485 4 3 Qatar 78,754 5 2 Delaware 69,288 6 4 Iceland 64,548 7 5 Ireland 60,209 7 6 Switzerland 58,513 8 7 Denmark 57,137 9 3 Connecticut 50,332 10 8 Sweden 49,603 11 9 Finland 46,856 12 10 Netherlands 46,774 13 4 Massachusetts 46,721 13 5 New York 46,617 14 11 United Kingdom 46,099 15 12 United States 45,725 16 6 New Jersey 44,885 17 13 Austria 44,852 18 7 Alaska 43,748 19 14 Canada 43,674 20 15 Australia 43,163 21 16 Belgium 42,618 22 17 United Arab Emirates 42,501 23 18 France 42,034 24 8 Colorado 41,798 25 9 Virginia 41,702 26 10 California 41,663 27 11 Minnesota 41,295 28 19 Germany 40,400 29 12 Nevada 39,813 30 13 Washington 39,616 31 14 Illinois 39,514 32 15 Maryland 39,161 33 16 Wyoming 39,130 34 17 Hawaii 38,083 35 18 New Hampshire 37,666 36 19 Oregon 37,633 37 20 Texas 36,920 38 21 North Carolina 36,489 39 22 Nebraska 36,441 40 23 Rhode Island 36,292 41 24 South Dakota 35,842 42 25 Iowa 35,662 43 20 Italy 35,745 44 26 Wisconsin 35,390 45 27 Georgia 35,362 46 21 Singapore 35,163 47 28 Pennsylvania 34,828 48 29 Ohio 34,609 49 30 Vermont 34,472 50 31 North Dakota 34,446 51 32 Tennessee 34,321 52 20 Japan 34,296 53 33 Kansas 34,242 54 34 Indiana 34,058 55 35 Florida 33,718 56 23 Kuwait 33,687 57 36 Michigan 33,468 58 37 Arizona 33,441 59 38 Missouri 33,297 60 39 Louisiana 32,923 61 40 Utah 32,357 62 20 Spain 32,090 63 41 New Mexico 31,986 64 25 Brunei 31,879 65 42 Idaho 30,896 66 26 New Zealand 30,390 67 43 Maine 30,305 68 44 Kentucky 29,842 69 45 Alabama 29,697 70 46 South Carolina 29,642 71 47 Oklahoma 29,545 72 27 Greece 28,152 73 48 Montana 27,942 74 49 Arkansas 27,875 75 50 West Virginia 24,748 76 51 Mississippi 24,062 See also
- Comparison between U.S. states and countries by GDP (nominal)
- Comparison between U.S. states and countries by GDP (PPP)
- List of countries by GDP (nominal) per capita - GDP at market or government official exchange rates per inhabitant
- List of countries by GDP (PPP) per capita - GDP at purchasing power parity exchange rates per inhabitant
- List of regions by past GDP (PPP) per capita - for the periods between 1 AD and 2003 AD
External links
- News release on 2005 gross state product, US Bureau of Economic Analysis, October 26, 2006
- World Economic Outlook Database, International Monetary Fund (IMF), April 2006
- World and EU (World Economic Outlook Database) IMF, April 2006
Categories:- Economy of the United States
- Economics lists by country
- Macroeconomics
- Gross Domestic Product
- Economics comparisons

Wikimedia Foundation. 2010.