- Copeland (UK Parliament constituency)
-
Coordinates: 54°25′52″N 3°23′20″W / 54.431°N 3.389°W
Copeland County constituency for the House of Commons 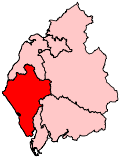
Boundary of Copeland in Cumbria.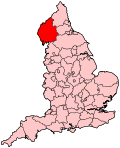
Location of Cumbria within England.County Cumbria Electorate 63,696 (December 2010)[1] Major settlements Whitehaven Current constituency Created 1983 Member of Parliament Jamie Reed (Labour) Number of members One Created from Whitehaven Overlaps European Parliament constituency North West England Copeland is a county constituency represented in the House of Commons of the Parliament of the United Kingdom. It elects one Member of Parliament (MP) by the first past the post system of election.
Contents
Boundaries
In 1983, the existing Whitehaven constituency was renamed Copeland; Jack Cunningham, who had previously been the member for Whitehaven, stood for and won the seat. Its boundaries remained unchanged, being co-terminous with the local government district of Copeland.
Boundary review
Following their review of parliamentary representation in Cumbria, the Boundary Commission for England have created a modified Copeland seat as a consequence of population changes.
The seat moves out of the district of Copeland and into Keswick for the first time, which was the main topic in public consultations regarding the changes.
The Allerdale wards of Crummock, Dalton, Derwent Valley and Keswick are added to the Copeland district for this seat.
Members of Parliament
Election Member[2] Party 1983 Jack Cunningham Labour 2005 Jamie Reed Labour Elections
Elections in the 2010s
General Election 2010: Copeland[3] Party Candidate Votes % ±% Labour Jamie Reed 19,699 46.0 -0.7 Conservative Chris Whiteside 15,866 37.1 +3.6 Liberal Democrat Frank Hollowell 4,365 10.2 -3.7 BNP Clive Jefferson 1,474 3.4 UKIP Edward Caley-Knowles 994 2.3 +0.1 Green Jill Perry 389 0.9 Majority 3,833 9.0 Turnout 42,787 67.6 +5.4 Labour hold Swing -2.1 Elections in the 2000s
General Election 2005: Copeland Party Candidate Votes % ±% Labour Jamie Reed 17,033 50.5 -1.3 Conservative Chris Whiteside 10,713 31.7 -5.8 Liberal Democrat Frank Hollowell 3,880 11.5 +0.8 UKIP Edward Caley-Knowles 735 2.2 Independent Brian Earley 734 2.2 English Democrats Alan Mossop 662 2.0 Majority 6,320 18.7 Turnout 33,757 62.3 -2.6 Labour hold Swing -2.2 General Election 2001: Copeland Party Candidate Votes % ±% Labour Jack Cunningham 17,991 51.8 -6.4 Conservative Mike Graham 13,027 37.5 +8.3 Liberal Democrat Mark Gayler 3,732 10.7 +1.5 Majority 4,964 14.3 Turnout 34,750 64.9 -11.4 Labour hold Swing Elections in the 1990s
General Election 1992: Copeland[4] Party Candidate Votes % ±% Labour Jack Cunningham 22,328 48.7 +1.5 Conservative PG Davies 19,889 43.4 +0.4 Liberal Democrat RC Putnam 3,508 7.6 −1.5 Natural Law JR Sinton 148 0.3 N/A Majority 2,439 5.3 +1.1 Turnout 45,873 83.5 +2.2 Labour hold Swing +0.5 See also
Notes and references
- ^ "Electorate Figures - Boundary Commission for England". 2011 Electorate Figures. Boundary Commission for England. 4 March 2011. http://www.boundarycommissionforengland.org.uk/electoral-figures/electoral-figures.htm. Retrieved 13 March 2011.
- ^ Leigh Rayment's Historical List of MPs – Constituencies beginning with "C" (part 5)
- ^ Copeland, BBC News
- ^ "UK General Election results April 1992". Richard Kimber's Political Science Resources. Politics Resources. 9 April 1992. http://www.politicsresources.net/area/uk/ge92/i06.htm. Retrieved 2010-12-06.
Categories:- Politics of Cumbria
- Parliamentary constituencies in North West England
- United Kingdom Parliamentary constituencies established in 1983
- Copeland
- United Kingdom constituency stubs


Wikimedia Foundation. 2010.