- Morecambe and Lunesdale (UK Parliament constituency)
-
Coordinates: 54°05′20″N 2°49′26″W / 54.089°N 2.824°W
Morecambe and Lunesdale County constituency for the House of Commons 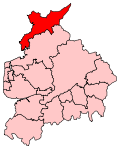
Boundary of Morecambe and Lunesdale in Lancashire.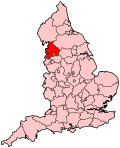
Location of Lancashire within England.County Lancashire Electorate 69,254 (December 2010)[1] Current constituency Created 1950 Member of Parliament David Morris (Conservative) Number of members One Created from Lonsdale Overlaps European Parliament constituency North West England Morecambe and Lunesdale is a county constituency represented in the House of Commons of the Parliament of the United Kingdom. It elects one Member of Parliament (MP) by the first past the post system of election.
Contents
Boundaries
The seat is similar to the Morecambe and Lonsdale constituency which existed until 1983. For the General Election of that year, sections of the constituency were united with the former county of Westmorland in the Westmorland and Lonsdale constituency and the constituency name was changed to its current form.
This seat brings together the northern rural reaches of Lancashire, including Carnforth on the Cumbria border, and the seaside resort of Morecambe and the nuclear power station/ferry port village of Heysham.
In boundary changes in the 2000s, only minor adjustments were made to this seat. Once a safe Tory seat, Morecambe has followed its neighbour and fellow seaside town, Blackpool, by voting Labour since 1997; the results in the General Elections of 1997, 2001 and 2005 had remarkably similar majorities with virtually no swing to the Conservatives. However the Conservatives gained the seat at the 2010 General Election with an above average swing.
Boundary review
Following their review of parliamentary representation in Lancashire, the Boundary Commission for England has maintained the current seat of Morecambe and Lunesdale, with only minor boundary alterations. The electoral wards used to create the seat are entirely within the boundaries of the City of Lancaster
- Bolton-le-Sands, Carnforth, Halton-with-Aughton, Harbour, Heysham Central, Heysham North, Heysham South, Kellet, Overton, Poulton, Silverdale, Skerton East, Skerton West, Slyne-with-Hest, Torrisholme, Upper Lune Valley, Warton and Westgate.
"Poulton" should not be confused with Poulton-le-Fylde near Blackpool.
"Warton" should not be confused with Warton near Kirkham.
Members of Parliament
Election Member [2] Party 1950 constituency created as "Morecambe and Lonsdale" 1950 Ian Fraser Conservative 1958 by-election Basil de Ferranti Conservative 1964 Alfred Hall-Davis Conservative 1979 Mark Lennox-Boyd Conservative 1983 constituency renamed as "Morecambe and Lunesdale" after boundary changes 1983 Mark Lennox-Boyd Conservative 1997 Geraldine Smith Labour 2010 David Morris Conservative Elections
Elections in the 2010s
General Election 2010: Morecambe and Lunesdale[3] Party Candidate Votes % ±% Conservative David Morris 18,035 41.5 +4.2 Labour Geraldine Smith 17,169 39.5 -9.5 Liberal Democrat Les Jones 5,691 13.3 -0.3 UKIP Nigel Brown 1,843 4.2 +4.2 Green Chris Coates 598 1.4 +1.4 Majority 866 2.0 -9.5 Turnout 43,436 62.1 +0.7 Conservative gain from Labour Swing -6.9 Elections in the 2000s
General Election 2005: Morecambe and Lunesdale Party Candidate Votes % ±% Labour Geraldine Smith 20,331 48.8 -0.8 Conservative James Airey 15,563 37.4 +0.1 Liberal Democrat Alex Stone 5,741 13.8 +4.6 Majority 4,768 11.5 Turnout 41,635 61.4 +0.3 Labour hold Swing -0.4 General Election 2001: Morecambe and Lunesdale Party Candidate Votes % ±% Labour Geraldine Smith 20,646 49.6 +0.7 Conservative David Nuttall 15,554 37.3 +0.6 Liberal Democrat Christopher Cotton 3,817 9.2 -2.2 UKIP Greg Beaman 935 2.2 N/A Green Cherith Adams 703 1.7 N/A Majority 5,092 12.3 Turnout 41,655 61.1 -11.2 Labour hold Swing Elections in the 1990s
General Election 1997: Morecambe and Lunesdale Party Candidate Votes % ±% Labour Geraldine Smith 24,061 48.9 +24.0 Conservative Mark Lennox-Boyd 18,096 36.7 −14.2 Liberal Democrat June Greenwell 5,614 11.4 −10.3 Referendum Party Ian Ogilvie 1,313 2.7 +2.7 Natural Law David Walne 165 0.3 −0.2 Majority 5,965 12.1 Turnout 49,249 72.3 Labour gain from Conservative Swing +19.1 General Election 1992: Morecambe and Lunesdale[4] Party Candidate Votes % ±% Conservative Mark Lennox-Boyd 22,507 50.9 −1.8 Labour Ms Jean E. Yates 10,998 24.9 +2.4 Liberal Democrat Tony J. Saville 9,584 21.7 −3.2 Morecambe Bay Independent Mark A. Turner 916 2.1 N/A Natural Law Richard M. Marriot 205 0.5 N/A Majority 11,509 26.0 −1.8 Turnout 44,210 78.3 +2.2 Conservative hold Swing −2.1 Elections in the 1980s
General Election 1987: Morecambe and Lunesdale Party Candidate Votes % ±% Conservative Mark Lennox-Boyd 22, 327 52.7 -3.9 Social Democrat Mrs. J. Greenwell 10,542 24.9 -0.3 Labour D. Smith 9, 535 22.5 +4.8 Majority 11, 785 Turnout 42, 404 76.1 Conservative hold Swing General Election 1983: Morecambe and Lunesdale Party Candidate Votes % ±% Conservative Mark Lennox-Boyd 21,968 56.6 Social Democrat T. Clare 9, 774 25.2 Labour A.C. Bryning 6, 882 17.7 Independent Mrs. I. Woods 208 0.5 Majority 12, 194 27.0 Turnout 38, 832 72.9 Conservative hold Swing See also
Notes and references
- ^ "Electorate Figures - Boundary Commission for England". 2011 Electorate Figures. Boundary Commission for England. 4 March 2011. http://www.boundarycommissionforengland.org.uk/electoral-figures/electoral-figures.htm. Retrieved 13 March 2011.
- ^ Leigh Rayment's Historical List of MPs – Constituencies beginning with "M" (part 3)
- ^ Morecambe and Lunsdale UKPolling
- ^ "UK General Election results April 1992". Richard Kimber's Political Science Resources. Politics Resources. 9 April 1992. http://www.politicsresources.net/area/uk/ge92/i14.htm. Retrieved 2010-12-06.
Categories:- Parliamentary constituencies in North West England
- United Kingdom Parliamentary constituencies established in 1983
- Politics of Lancaster


Wikimedia Foundation. 2010.