- 2001–02 South Pacific cyclone season
-
2001–02 South Pacific cyclone season 
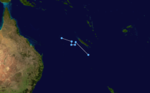
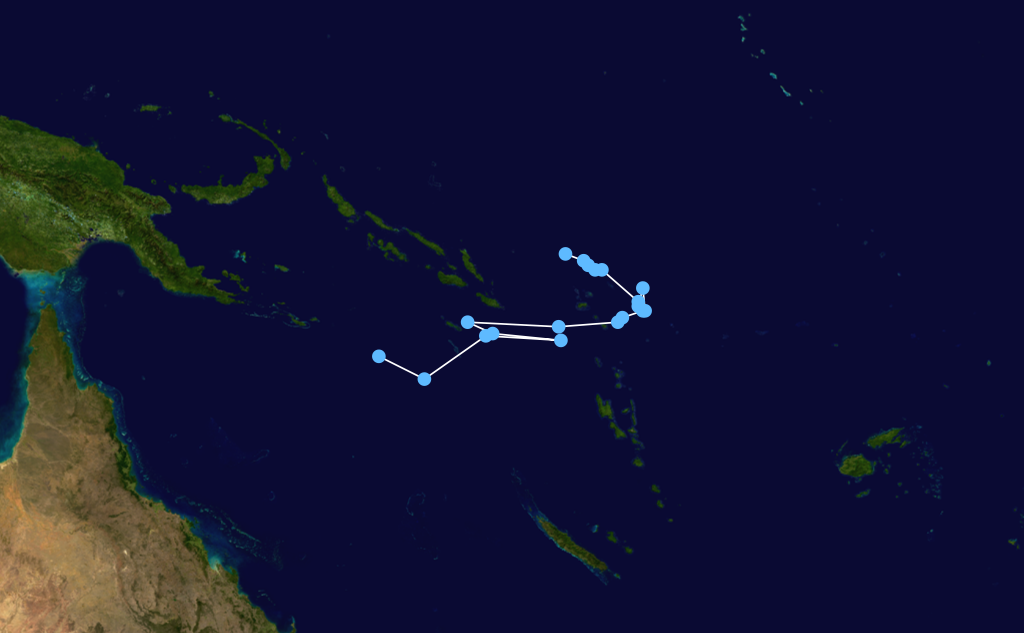
Season summary mapFirst storm formed: November 29, 2001 Last storm dissipated: April 23, 2002 Strongest storm: Waka – 930 hPa (mbar), 185 km/h (115 mph) (10-minute sustained) Total depressions: 16 Total storms: 5 Tropical cyclones: 2 Total fatalities: None reported Total damage: $51.3 million (2002 USD) South Pacific cyclone seasons
1999–00, 2000–01, 2001–02, 2002–03, 2003–04Related articles: The 2001–02 South Pacific cyclone season was a below-average year in which only five named storms formed or entered the South Pacific basin. It began on 1 November 2001 and ended on 30 April 2002. These dates conventionally delimit the period of each year when most tropical cyclones form in the southern Pacific Ocean east of 160°E. Additionally, the regional tropical cyclone operational plan defines a tropical cyclone year separately from a tropical cyclone season, and the "tropical cyclone year" runs from 1 July 2001 to 30 June 2002.[1]
The South Pacific Basin, as defined by the World Meteorological Organization, is split into two sub-areas, monitored by separate agencies. The first area is between 160°E and 120°W and north of 25°S are monitored by the Fiji Meteorological Service in Nadi. Those that move south of 25°S are monitored by the Tropical Cyclone Warning Centre in Wellington, New Zealand.[1] At the start of the season, a new naming policy was introduced by the Tropical Cyclone Committee for the South Pacific and South- East Indian Ocean. The policy stated that a storm attaining gale-force winds in only one quadrant near its center would be named by the Fiji Meteorological Service. This is in contrast to the previous policy in which gale-force winds had to completely surround the center to be named.[2]
Seasonal summary

During the 2000–01 South Pacific cyclone season, only five tropical cyclones and two severe tropical cyclone formed or entered the region. Compared to an average season, which generally features nine tropical cyclones and four to five severe tropical cyclones, the 2000–01 season was substantially below average. This continued an inactive trend seen by several seasons prior; however, it was slightly more active than the previous year. Aside from Tropical Cyclone Trina, every storm in the basin formed in relation to the Madden–Julian oscillation (MJO) phase. There were four pulses of this feature throughout the course of the season; the first resulted in the formation of Waka and Vicky and the second resulted in the formation of Claudia and Des. The remaining tropical depressions formed in relation to all of the pulses.[2]
Storms
Tropical Cyclone Trina
Category 1 tropical cyclone (Australian scale) Tropical storm (SSHS) 

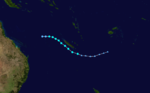
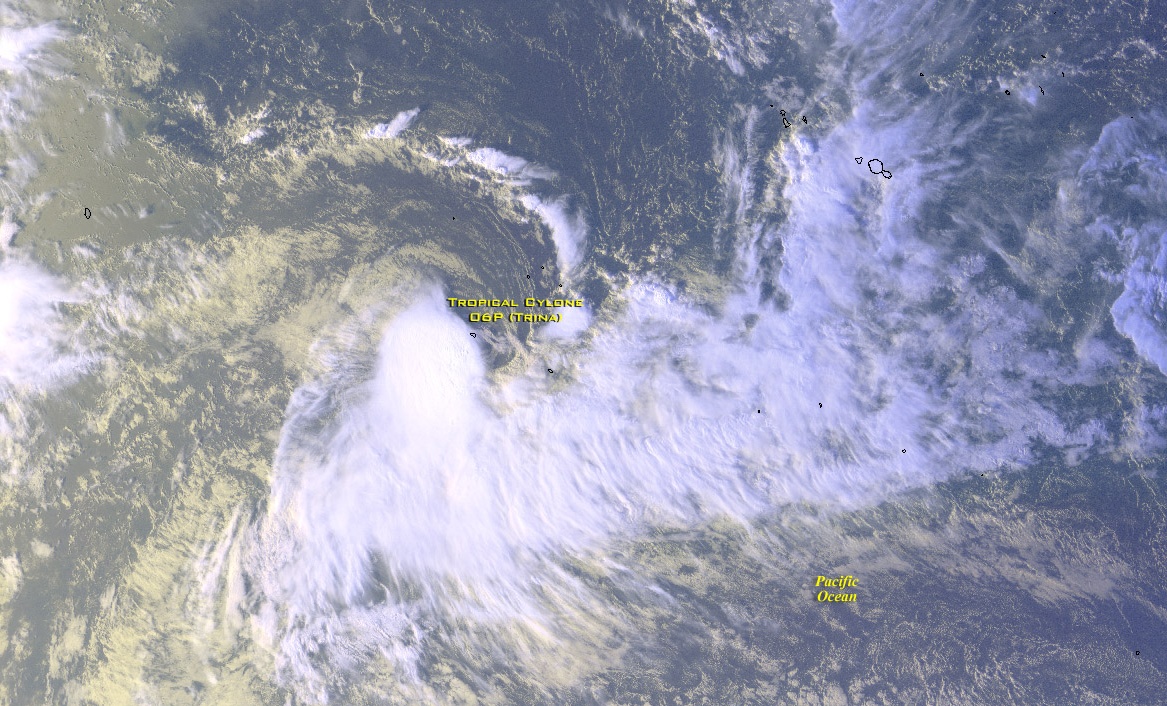
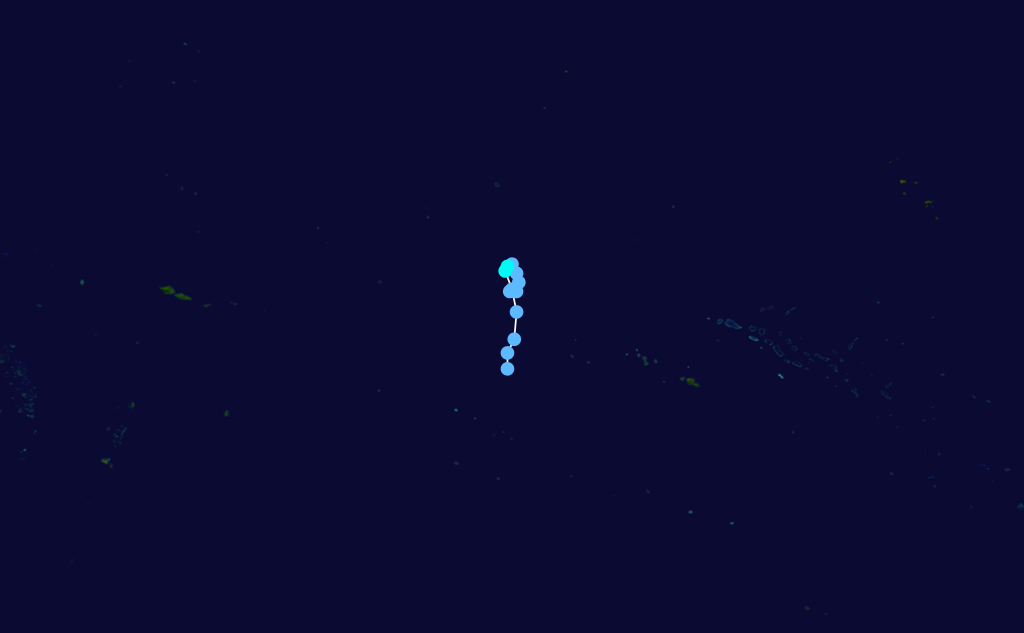
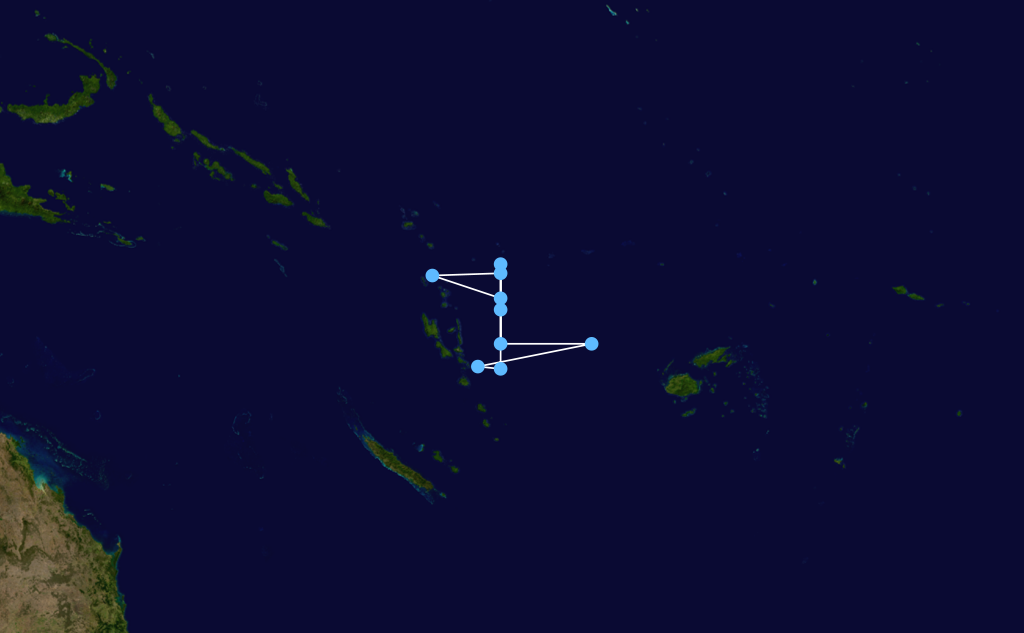
Duration November 29 – December 3 Intensity 65 km/h (40 mph) (10-min), 995 mbar (hPa) Main article: Tropical Cyclone TrinaThe first tropical cyclone of the year, Trina formed upper-level low pressure system on November 30 near the island of Rarotonga. Remaining nearly sationary, the storm meandered in the same general area for over a week. Due to unfavorable conditions for tropical cyclogenesis, the storm struggled to develop significant convection, preventing it from intensifying beyond 65 km/h (40 mph). After finally succumbing to wind shear on December 2, the system weakened to a tropical depression near Mangaia and dissipated several days later.[2]
Due to the slow movement of the storm, it produced substantial rainfall over the island of Mangaia, resulting in some of the worst flooding in 50 years.[3] Although no people were killed, nearly 60% of the islands' livestock died and 90% of the staple crop was lost. Estimates from the Cook Islands National Disaster Management Council placed damage at $52,000.[4]
Tropical Depression 02F
Tropical depression (Australian scale) 

Duration December 8 – December 10 Intensity 45 km/h (30 mph) (10-min), 1000 mbar (hPa) On December 8, a new tropical depression developed near Fiji.[5] Tracking westward, the system attained a peak intensity of 45 km/h (30 mph) with a minimum pressure of 1000 mbar (hPa; 29.53 inHg) before weakening took place.[6] By December 10, the system transitioned into an extratropical cyclone.[5] Over the following several days, the remnants of the depression drifted southeastward and were last noted on December 15 to the southeast of Fiji.[6]
Severe Tropical Cyclone Waka
Category 4 severe tropical cyclone (Australian scale) Category 3 tropical cyclone (SSHS) 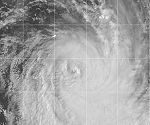
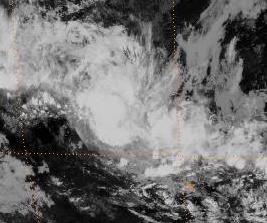
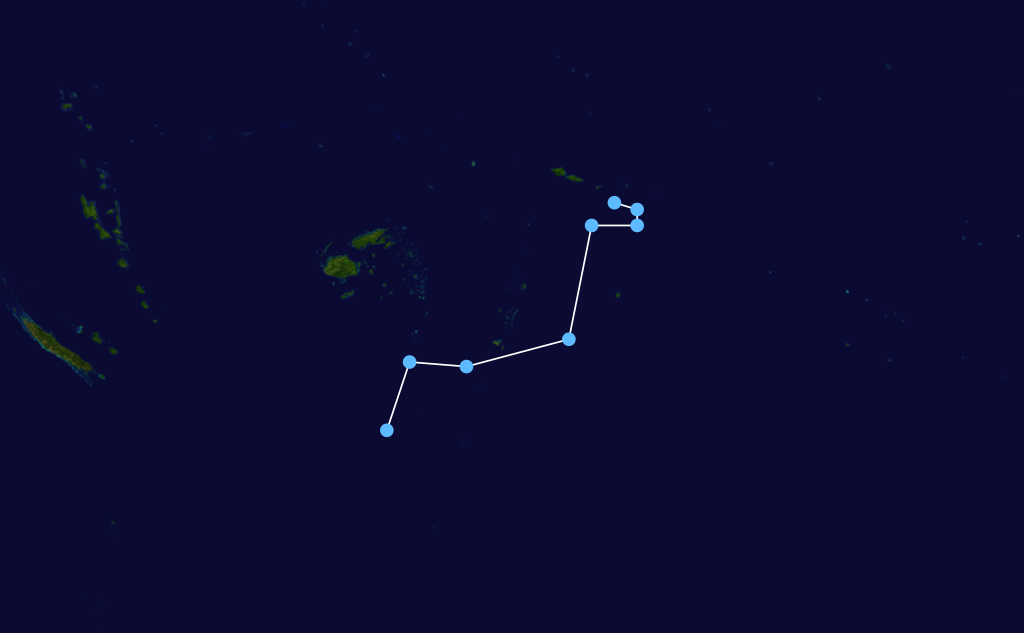
Duration December 19 – January 2 Intensity 185 km/h (115 mph) (10-min), 930 mbar (hPa) Main article: Cyclone WakaWaka originated in a near-equatorial trough of low pressure in mid-December 2001, although the system remained disorganized for more than a week. The storm gradually matured and attained tropical cyclone status on December 29. Subsequently, Waka underwent rapid intensification in which it attained its peak intensity as a Category 4 severe tropical cyclone on December 31, with winds of 185 km/h (115 mph). Shortly thereafter, it passed directly over Vava'u, resulting in widespread damage. By January 1, 2002, the cyclone began to weaken as it underwent an extratropical transition. The remnants of Waka persisted for several more days and were last observed near the Southern Ocean on January 6.[2]
Throughout Waka's path, several countries were impacted by the storm; however, the most significant losses took place in Tonga.[2] There, one person was killed and 104.2 million paʻanga ($51.3 million USD) was wrought in damage.[7] Hundreds of structures were destroyed and much of the nation's agriculture was destroyed.[8] Winds in excess of 185 km/h (115 mph) battered Vava'u, destroying 200 homes in the island's largest city.[9] In addition to infrastructural and public losses, the environment was also severely affected; a native species of bats lost roughly 80% of its population due to the lack of fruit.[10] Following the storm, Tonga requested international aid to cope with the scale of damage.[11]
Tropical Cyclone Vicky
Category 1 tropical cyclone (Australian scale) 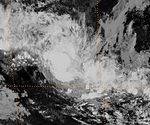

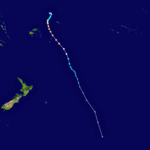
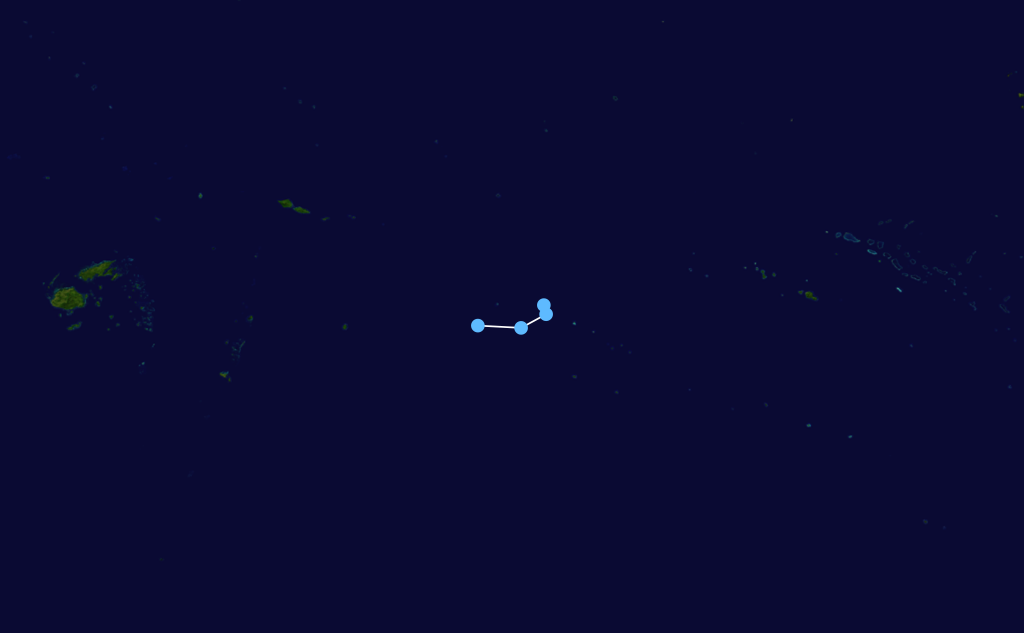
Duration December 22 – December 26 Intensity 65 km/h (40 mph) (10-min), 996 mbar (hPa) Forming out of the same initial disturbance as Cyclone Waka, Tropical Cyclone Vicky formed within a region of moderate wind shear, inhibiting substantial development. The storm was first classified by the FMS on December 22 over open waters. Situated to the south of an upper-level ridge, the system tracked slowly towards the northeast and intensified, despite unfavorable conditions. Over the following two days, convection managed to persist along the northern edge of the system's center of circultaion and on December 24, the FMS classified the low as Tropical Cyclone Vicky. At this time, Vicky was situated roughly 900 km (560 mi) north-northeast of Rarotonga. Shortly thereafter, wind shear increased in relation to an approaching trough, resulting in Vicky weakening to a tropical depression. Over the following several days, the depression drifted southward before entering the mid-latitude westerlies and re-intensifying into a strong extratropical cyclone well to the south of French Polynesia.[2]
Tropical Depression 05F
Tropical depression (Australian scale) 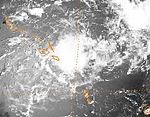

Duration December 31 – January 6 (out of area) Intensity 65 km/h (40 mph) (10-min), 998 mbar (hPa) On December 31, the FMS began monitoring a new tropical depression, classified as 05F, roughly 600 km (375 mi) east-northeast of the Solomon Islands. A large system, similar to a monsoonal depression, 05F drifted southeastward for several days before turning towards the southwest.[12] On January 1, the system attained its peak intensity with winds of 65 km/h (40 mph) and a pressure of 998 mbar (hPa; 29.47 inHg).[13] Despite having gale-force winds, the system was not classified as a tropical cyclone since the winds were significantly displaced from the center of circulation.[12] the JTWC determined the system had a good chance of developing into a tropical cyclone and issued a TCFA; however, this was later canceled as the depression failed to strengthen. By January 6, the system crossed 160°E and entered the Australian Bureau of Meteorology's area of responsibility.[12]
Tropical Depression 06F
Tropical depression (Australian scale) 
Duration January 15 – January 16 Intensity 65 km/h (40 mph) (10-min), 1000 mbar (hPa) Tropical Depression 07F
Tropical depression (Australian scale) 
Duration January 20 – January 27 Intensity 65 km/h (40 mph) (10-min), 997 mbar (hPa) Severe Tropical Cyclone Claudia
Category 3 severe tropical cyclone (Australian scale) Category 1 tropical cyclone (SSHS) 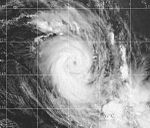
Duration February 12 (entered basin) – February 14 Intensity 120 km/h (75 mph) (10-min), 965 mbar (hPa) During the second phase of the MJO, a new low pressure system developed over the Coral Sea, on February 9. Situated between two troughs over eastern Australia and the Tasman Sea, the system tracked towards the southeast and rapidly organized.[2] The system was classified as Tropical Cyclone Claudia on February 11 and upgraded to a severe tropical cyclone less than 24 hours later.[14] Later on February 12, the system crossed 160°E, entering the South Pacific basin at peak intensity. Maximum winds were estimated at 120 km/h (75 mph) and its minimum pressure was 965 mbar (hPa; 28.49 inHg). A ragged eye was briefly seen on satellite imagery before Claudia moved over decreasing sea surface temperatures. The combined effects of its rapid forward speed and increased wind shear quickly weakened the system. By February 13, Claudia had weakened to a non-convective tropical depression. The remnants of the storm persisted for another day before being absorbed by a frontal system well to the south of Tonga.[2]
Tropical Depression 09F
Tropical depression (Australian scale) 
Duration February 17 – February 18 Intensity 75 km/h (45 mph) (10-min), 997 mbar (hPa) Tropical Depression 10F
Tropical depression (Australian scale) Tropical storm (SSHS) 

Duration February 23 – February 26 Intensity 55 km/h (35 mph) (10-min), 1000 mbar (hPa) Tropical Disturbance 11F
Tropical disturbance (Australian scale) 
Duration February 26 – February 27 Intensity 30 km/h (15 mph) (10-min), 1002 mbar (hPa) Tropical Cyclone Des
Category 2 tropical cyclone (Australian scale) Tropical storm (SSHS) 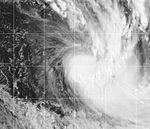
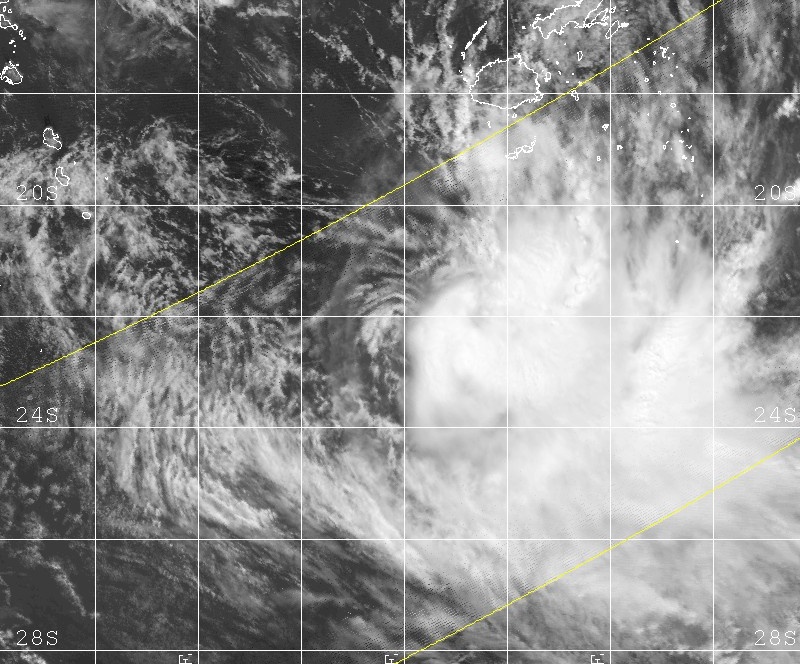
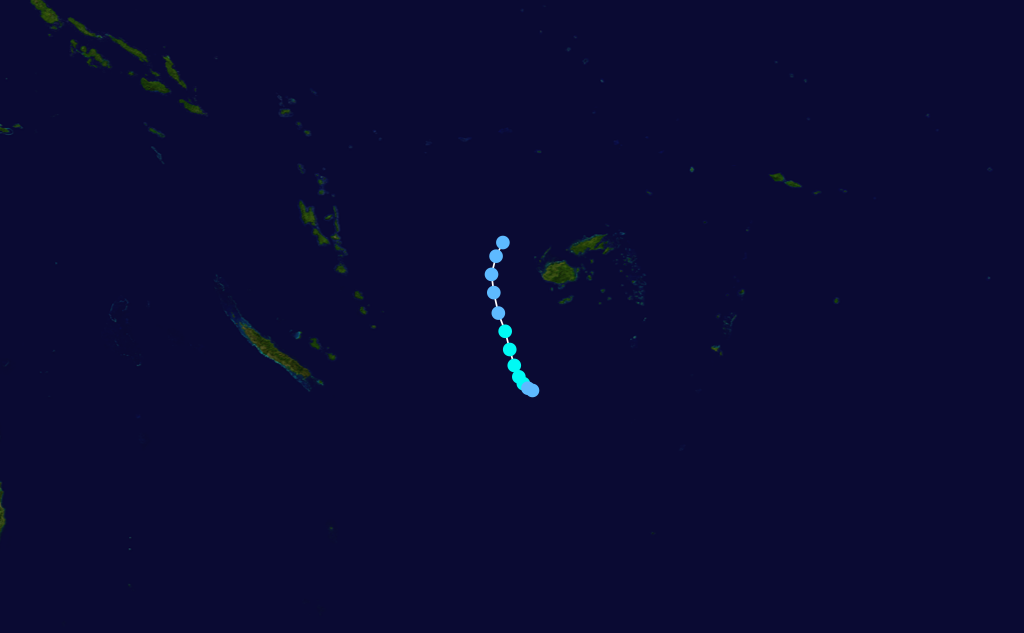
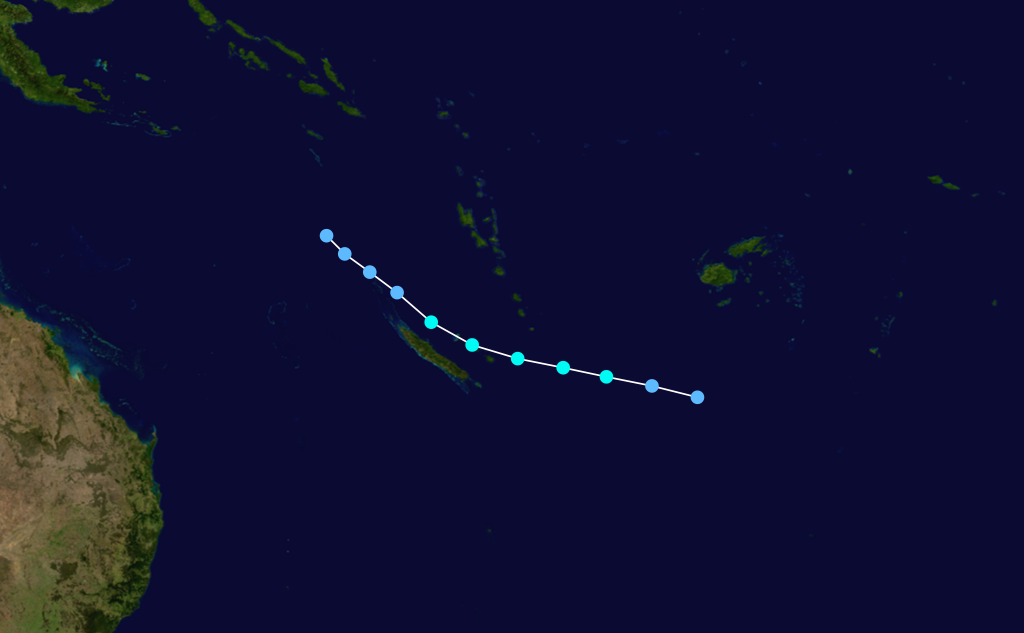
Duration March 5 – March 7 Intensity 95 km/h (60 mph) (10-min), 985 mbar (hPa) Following a pattern similar to the formation of Cyclone Claudia, Des formed out of an area of disturbed weather east of Australia in late February. The precursor system formed at the same time as the initial disturbance which developed into Typhoon Mitag in the northwestern Pacific. By March 4, sufficient development had taken place to classify the system as a tropical depression and a tropical cyclone early the next day. During March 5, Des underwent a brief period of rapid intensification,[2] attaining its peak strength of 60 mph (95 km/h) with a minimum pressure of 985 mbar (hPa; 29.09 inHg).[13] Initially, the storm was forecast to impact New Caledonia; however, a mid-level ridge to the northeast forced the system to the southeast, sparing the island of a direct hit. Due to the storm's proximity to the mountains of New Caledonia and less favorable environmental conditions, Des began to weaken on March 6. The following day, the storm was devoid of convection, marking its degeneration into a remnant low pressure system.[2] The remnants of Des were monitored for a few more days before they dissipated south of Fiji.[13]
Since Des remained off the coast of New Caledonia, the storm's strongest winds did not impact land; however, weather stations along the coast measured winds of 75 to 95 km/h (47 to 59 mph). No damage was reported in relation to Cyclone Des.[2]
Tropical Depression 13F
Tropical depression (Australian scale) Tropical storm (SSHS) 

Duration March 13 – March 16 Intensity 65 km/h (40 mph) (10-min), 1000 mbar (hPa) Tropical Depression 14F
Tropical depression (Australian scale) 
Duration March 18 – March 23 Intensity 65 km/h (40 mph) (10-min), 1002 mbar (hPa) Tropical Depression 15F
Tropical depression (Australian scale) 
Duration April 1 – April 2 Intensity Winds unknown, 1002 mbar (hPa) Tropical Depression 16F
Tropical depression (Australian scale) 
Duration April 17 – April 23 Intensity Winds unknown, 1002 mbar (hPa) Season effects
This table lists all the storms that developed in the South Pacific to the east of longitude 160°E during the 2001-2002 season. It includes their intensity on the Australian Tropical cyclone intensity scale, duration, name, landfalls, deaths, and damages. All data is taken from RSMC Nadi and or TCWC Wellington. The Damage figures are all 2002 USD.
2001-02 South Pacific Cyclone statistics Storm name Active dates Storm category at peak intensity
Max wind
(mph)
Min. press.
(mbar)
Landfall(s) Damage (millions
USD)
Deaths Where When Wind (mph)
Trina October 16 – October 19 Category 1 cyclone 40 995 Rarotonga November 29 35 0.054 0 02F December 8 – December 10 Tropical depression 30 1000 Ngau, Fiji December 8 30 Unknown 0 Wakaya, Fiji December 9 30 Viti Levu, Fiji December 9 30 Waka December 19 – January 2 Category 4 cyclone 115 930 Wallis Island December 30 60 51.3 1 Niuafo'ou, Tonga December 30 90 Fonualei, Tonga December 31 115 Toku Island, Tonga December 31 115 Vava'u, Tonga December 31 115 Vicky December 22 – December 26 Category 1 cyclone 40 996 none None 0 05F December 31 – January 6 Tropical depression 40 998 Tevai, Solomon Islands January 4 40 None 0 Naunonga, Solomon Islands January 4 40 06F January 15 – January 16 Tropical depression 40 1000 New Caledonia (Direct hit, no landfall) January 15 40 None 0 07F January 20 – January 27 Tropical depression 40 997 Erromango, Vanuatu January 22 40 None 0 Houaïlou, New Caledonia January 26 40 Claudia February 12 – February 14 Category 3 cyclone 75 965 none None 0 09F February 17 – February 18 Tropical depression 45 997 Vanua Valabu, Fiji February 18 45 None 0 Nayau, Fiji February 18 45 Lakemba, Fiji February 18 45 Aiwa, Fiji February 18 45 10F February 23 – February 26 Tropical depression 35 1000 none None 0 11F February 26 – February 27 Tropical disturbance 15 1002 none None 0 Des March 5 – March 7 Category 2 cyclone 60 985 none None 0 13F March 13 – March 16 Tropical depression 40 1000 none None 0 14F March 18 – March 23 Tropical depression 40 1002 none None 0 15F April 1 – April 2 Tropical depression Unk. 1002 none None 0 16F April 17 – April 23 Tropical depression Unk. 1002 none None 0 Season Aggregates 16 Disturbances November 29 – April 23 115 930 17 landfalls 51.354 1 Storm names
South Pacific tropical cyclones are usually assigned names by the RSMC in Nadi, or Fiji Meteorological Service. As soon as a tropical depression becomes a tropical cyclone it is named by the warning centre having responsibility for it at that time. If a tropical depression becomes a tropical cyclone in the Wellington RSMC area of responsibility, TCWC Wellington, in consultation with RSMC Nadi, will name the cyclone by using the next name from the list.[15] Two of the named storms this season, Claudia and Des, originated west of 160°E and were named by TCWC Brisbane. The name Walter was originally meant to be used on this list but for unknown reasons it was replaced with Waka shortly before the name was used. After this season, the names Trina and Waka were retired and have been replaced with Tino and Wiki respectively.[11]
-
Amos
-
Bart
-
Cora
-
Dani
-
Ella
-
Frank
-
Gita
-
Hali
-
Iris
-
Jo
-
Kim
-
Leo
-
Mona
-
Neil
-
Oma
-
Paula
-
Rita
-
Sose
- Trina
- Vicky
- Waka
-
Yolande
-
Zoe
See also
- List of Southern Hemisphere tropical cyclone seasons
- Atlantic hurricane seasons: 2001, 2002
- Pacific hurricane seasons: 2001, 2002
- Pacific typhoon seasons: 2001, 2002
- North Indian Ocean cyclone seasons: 2001, 2002
References
- ^ a b "Tropical Cyclone Operation Plan for the South Pacific and South-East Indian Ocean" (PDF). World Meteorological Organization. 2006. http://www.wmo.ch/web/www/TCP/OperationPlans/TCP24-English2004.pdf. Retrieved December 7, 2010.
- ^ a b c d e f g h i j k Jonty D. Hall (2004). "The South Pacific and southeast Indian Ocean tropical cyclone season 2001-02" (PDF). Australian Meteorology Magazine (Queensland Regional Office, Bureau of Meteorology, Australia) 53 (4): 285–304. http://reg.bom.gov.au/amm/docs/2004/hall_hres.pdf. Retrieved December 5, 2010.
- ^ Australian Broadcasting Corporation (December 5, 2010). "Worst floods in half a century hit Mangaia in Cook Islands". http://reliefweb.int/rw/rwb.nsf/db900sid/ACOS-64CEFK?OpenDocument&rc=5&emid=ST-2001-0659-COK. Retrieved November 7, 2010.
- ^ United Nations Office for the Coordination of Humanitarian Affairs (December 19, 2001). "Cook Islands — Tropical Cyclone Trina OCHA Situation Report No. 2". ReliefWeb. http://reliefweb.int/rw/rwb.nsf/db900sid/ACOS-64BUTH?OpenDocument&rc=5&emid=ST-2001-0659-COK. Retrieved November 7, 2010.
- ^ a b Gary Padgett (December 27, 2006). "Monthly Tropical Weather Summary for December 2001". Australia Severe Weather. http://australiasevereweather.com/cyclones/2002/summ0112.htm. Retrieved November 8, 2010.
- ^ a b Gary Padgett (December 27, 2006). "Monthly Tropical Weather Tracks for December 2001". Australia Severe Weather. http://australiasevereweather.com/cyclones/2002/trak0112.htm. Retrieved November 8, 2010.
- ^ United Nations Office for the Coordination of Humanitarian Affairs (January 23, 2002). "OCHA Situation Report No. 2". Center for International Disaster Information. http://www.cidi.org/report/5532. Retrieved December 5, 2010.
- ^ "New Zealand to give Tonga 700,000 dollars for cyclone relief". Radio New Zealand International. January 8, 2002.
- ^ Reuters (January 3, 2002). "Red Cross seeks food aid after Tonga cyclone". ReliefWeb. http://www.reliefweb.int/rw/rwb.nsf/db900sid/OCHA-64C57T?OpenDocument&rc=5&emid=ST-2001-0711-TON. Retrieved December 2, 2010.
- ^ Kim R. McConkey, Donald R. Drake, Janet Franklin and Filipe Tonga (2004). "Effects of Cyclone Waka on flying foxes (Pteropus tonganus) in the Vava'u Islands of Tonga". Journal of Tropical Ecology (Cambridge University Press) 20 (5): 555–561. doi:10.1017/S0266467404001804. http://journals.cambridge.org/action/displayAbstract?fromPage=online&aid=240809. Retrieved December 4, 2010.
- ^ a b "Tropical Cyclone Operation Plan for the South Pacific and South-East Indian Ocean" (PDF). World Meteorological Organization. 2008. http://www.wmo.int/pages/prog/www/tcp/documents/TCP24-English2008.pdf. Retrieved December 5, 2010.
- ^ a b c Gary Padgett (December 27, 2006). "Monthly Tropical Weather Summary for January 2002". Australia Severe Weather. http://australiasevereweather.com/cyclones/2002/summ0201.htm. Retrieved November 8, 2010.
- ^ a b c "TCWC Wellington Best Track Data 1967–2006" (XLS). Fiji Meteorological Service, Meteorological Service of New Zealand Limited, Bureau of Meteorology. National Oceanic and Atmospheric Administration. 2009-05-22. ftp://eclipse.ncdc.noaa.gov/pub/ibtracs/original-bt-data-files/wellington/TC_BT_1967_2006.xls. Retrieved December 5, 2010.
- ^ "Severe Tropical Cyclone Claudia". Australian Bureau of Meteorology. 2010. http://www.bom.gov.au/cyclone/history/claudia.shtml. Retrieved December 7, 2010.
- ^ "Tropical Cyclone Operational Plan for the South Pacific and South-East Indian Ocean 1999". World Meteorological Organization. 1999. http://www.wmo.int/pages/prog/www/tcp/documents/doc/Op-pln99.doc. Retrieved November 8, 2010.
External links
- World Meteorological Organization
- Fiji Meteorological Service
- Meteorological Service of New Zealand
- Joint Typhoon Warning Center
2000–09 South Pacific cyclone seasons -


Wikimedia Foundation. 2010.