- Nova Scotia general election, 2009
-
2009 Nova Scotia general election 
2006 ←
membersJune 9, 2009
members→ 39th 52 seats of the Nova Scotia House of Assembly
27 seats were needed for a majorityFirst party Second party Third party 

Leader Darrell Dexter Stephen McNeil Rodney MacDonald Party New Democrat Liberal Progressive Conservative Leader since 2001 2007 2006 Leader's seat Cole Harbour Annapolis Inverness Last election 20 9 23 Seats won 31 11 10 Seat change +11 +2 −13 Popular vote 186,556 112,160 101,203 Percentage 45.24% 27.20% 24.54% Swing +10.61% +3.76% -15.03%
Premier before election
Rodney MacDonald
Progressive ConservativePremier-designate
The 38th Nova Scotia general election was held on June 9, 2009 to elect members of the 61st House of Assembly of the Province of Nova Scotia, Canada. The government was defeated on a money bill on May 4, and the Nova Scotia House of Assembly was dissolved by Lieutenant Governor Mayann Francis on May 5.[1]
Contents
Campaign
The election campaign began on May 5, 2009, after the New Democrats and Liberals voted against the Offshore Offset Revenues Expenditure Act, legislation that would have permitted the government to divert its revenues from oil and gas development in the Atlantic Ocean from debt payment, as required under current provincial law, to fund extra spending in the 2009 budget.[2] As the Progressive Conservatives won only a minority government in the 2006 election, at least one of the two opposition parties would have been required to vote in favour of (or abstain from voting on) the legislation for it to pass.
Timeline
- June 13, 2006 - Rodney MacDonald's Progressive Conservatives are elected to a minority government. Liberal leader Francis MacKenzie resigns.
- March 1, 2007 - NDP MLA Kevin Deveaux resigns his seat of Cole Harbour-Eastern Passage
- April 28, 2007 - Stephen McNeil is elected leader of the Nova Scotia Liberal Party
- October 2, 2007 - Becky Kent of the NDP is elected in the Cole Harbour-Eastern Passage byelection.
- March 2, 2009 - Lunenburg MLA and Finance Minister Michael Baker dies.
- May 4, 2009 - Government is defeated on a budget bill (Bill 240 - Offshore Offset Revenues Expenditure Act (amendments to Provincial finance Act)).
- May 5, 2009 - Legislature is officially dissolved and writ of election dropped.
- May 19, 2009 - First official leaders' debate.
- June 2, 2009 - Second official leaders' debate.
- June 9, 2009 - Election Day – polls close at 7:00 PM ADT; CBC projects an NDP government at 7:30 PM ADT.[3]
Results by party
Party Party leader # of
candidatesSeats Popular vote 2006 Dissolution Elected % Change # % Change New Democratic Darrell Dexter 52 20 20 31 +55.0% 186,556 45.24% +10.61% Liberal Stephen McNeil 52 9 9 11 +22.2% 112,160 27.20% +3.76% Progressive Conservative Rodney MacDonald 52 23 21 10 −56.5% 101,203 24.54% −15.03% Green Ryan Watson 52 0 0 0 0.0% 9,636 2.34% +0.01% Independents 4 0 1 0 0.0% 2,796 0.68% +0.64% Vacant 1 Total 212 52 52 52 0.0% 411,310 100.00% 0.00% Candidates lined up.[4]
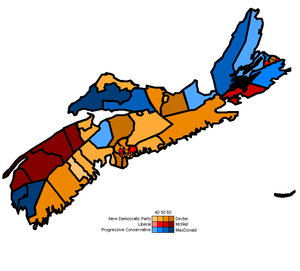
Results by region
Party name HRM C.B. Valley S. Shore Fundy Central Total Parties winning seats in the legislature New Democratic Party Seats: 14 2 2 5 4 4 31 Popular vote: 54.07% 40.16% 27.05% 43.03% 41.76% 50.10% 45.26% Liberal Seats: 4 3 4 - - - 11 Popular vote: 28.65% 29.57% 46.46% 18.11% 14.60% 16.84% 27.22% Progressive Conservative Seats: - 4 1 2 2 1 10 Popular vote: 14.36% 28.34% 23.89% 36.08% 37.44% 31.32% 24.52% Parties not winning seats in the legislature Green Popular vote: 2.88% 1.78% 2.60% 1.90% 1.89% 1.74% 2.33% Independents Popular vote: 0.03% 0.14% N/A 0.88% 4.32% N/A 0.67% Total seats: 18 9 7 7 6 5 52 Opinion polls
Polling firm Dates Link Prog. Cons. New Democratic Liberal Green 2009 Election Results June 9, 2009 [3] 24.5% 45.3% 27.2% 2.3% Angus Reid Strategies June 4, 2009 PDF 23% 47% 26% 3% Corporate Research Associates June 1, 2009 HTML 26% 44% 28% 2% Corporate Research Associates May 7-16, 2009 HTML 28% 37% 31% 3% Corporate Research Associates February 2009 HTML 30% 36% 31% 3% Corporate Research Associates November 2008 HTML 33% 37% 27% 3% Corporate Research Associates August 2008 HTML 33% 36% 28% 3% Corporate Research Associates May 2008 HTML 27% 38% 30% 4% Corporate Research Associates February 2008 HTML 32% 37% 28% 3% Corporate Research Associates November 2007 HTML 32% 39% 25% 3% Corporate Research Associates August 2007 HTML 32% 35% 28% 5% Corporate Research Associates May 2007 HTML 29% 37% 26% 7% Corporate Research Associates February 2007 HTML 35% 36% 25% 3% Corporate Research Associates November 2006 HTML 32% 37% 26% 4% Corporate Research Associates August 2006 HTML 33% 35% 24% - 2006 Election Results June 2006 [4] 40% 35% 24% 2% Riding results
- Winners are indicated by the party-coloured bar next to the winner's name.
- bold denotes a cabinet minister or party leader
- † denotes an incumbent not seeking re-election
Annapolis Valley
Electoral District Candidates Incumbent PC NDP Liberal Green Other Annapolis Kent Robinson
971 - (11.10 %)Henry Spurr
1,131 - (12.93 %)Stephen McNeil
6,446 - (73.70 %)Jamie Spinney
198 - (2.26 %)Stephen McNeil Clare Jimmy Doucet
459 - (8.75 %)Paul Comeau
1,326 - (25.29 %)Wayne Gaudet
3,392 - (64.68 %)Diane Bean
67 - (1.28 %)Wayne Gaudet Digby-Annapolis Cindy Nesbitt
852 - (15.39 %)Sherri Oliver
1,092 - (19.73 %)Harold Theriault
3,514 - (63.48 %)Namron Bean
78 - (1.41 %)Harold Theriault Hants West Chuck Porter
3,364 - (37.24 %)Barbara Gallagher
2,401 - (26.58 %)Paula Lunn
3,065 - (33.93 %)Sheila Richardson
204 - (2.26 %)Chuck Porter Kings North Mark Parent
3,079 - (36.08 %)Jim Morton
3,535 - (41.43 %)Shirley Fisher
1,541 - (18.06 %)Anna-Maria Galante-Ward
378 - (4.43 %)Mark Parent Kings South David Morse
2,759 - (28.14 %)Ramona Jennex
4,038 - (41.18 %)Paula Howatt
2,639 - (26.91 %)Brendan MacNeill
369 - (3.76 %)David Morse Kings West Chris Palmer
1,667 - (20.20 %)Carol Tobin
1,422 - (17.23 %)Leo Glavine
5,015 - (60.77 %)Nistal Prem de Boer
149 - (1.81 %)Leo Glavine South Shore
Electoral District Candidates Incumbent PC NDP Liberal Green Other Argyle Chris d'Entremont
2,818 - (64 %)Melvin Huskins
759 - (17.24 %)Lionel LeBlanc
752 - (17.08 %)Barbara Lake
74 - (1.68 %)Chris d'Entremont Chester-St. Margaret's Judy Streatch
2,762 - (27.47 %)Denise Peterson-Rafuse
4,835 - (48.09 %)Jo-Ann Grant
2,122 - (21.11 %)Ryan Cameron
335 - (3.33 %)Judy Streatch Lunenburg Peter Zwicker
2,399 - (28.30 %)Pam Birdsall
4,069 - (48.01 %)Rick Welsford
1,374 - (16.21 %)Jason Remai
145 - (1.71 %)Milton Countway
489 - (5.77 %)(vacant)a Lunenburg West Carolyn Bolivar-Getson
3,045 - (33.50 %)Gary Ramey
3,600 - (39.60 %)Mark Furey
2,297 - (25.27 %)Emily Richardson
148 - (1.63 %)Carolyn Bolivar-Getson Queens Kerry Morash
1,936 - (28.87 %)Vicki Conrad
4,012 - (59.82 %)Wayne Henley
674 - (10.05 %)Stuart Simpson
85 - (1.27 %)Vicki Conrad Shelburne Eddie Nickerson
1,637 - (23.59 %)Sterling Belliveau
3,844 - (55.41 %)Darian Huskilson
1,356 - (19.54 %)Robin Smith
101 - (1.46 %)Sterling Belliveau Yarmouth Richard Hurlburt
4,537 - (61.34 %)David Olie
1,696 - (22.93 %)David Mooney
1,041 - (14.07 %)Ronald Mills
123 - (1.66 %)Richard Hurlburt - ^a - Previously held by Progressive Conservative Michael Baker, who died in office on March 2, 2009.
Fundy-Northeast
Electoral District Candidates Incumbent PC NDP Liberal Green Other Colchester-Musquodoboit Valley Steve Streatch
2,265 - (29.07 %)Gary Burrill
3,697 - (48.09 %)Willie Versteeg
1,649 - (21.16 %)Margaret Whitney
181 - (2.32 %)Brooke Taylor† Colchester North Karen Casey
3,811 - (50.25 %)Arthur Hartlen
2,362 - (31.14 %)Lorenda Ebbett
1,250 - (16.48 %)Judy Davis
161 - (2.12 %)Karen Casey Cumberland North Keith Hunter
1,359 - (17.23 %)Brian Skabar
3,170 - (40.19 %)Brent Noiles
1,073 - (13.60 %)Aviva Silburt
127 - (1.61 %)Ernest Fage
2,159 - (27.37 %)Ernest Fage Cumberland South Murray Scott
4,334 - (67.66 %)Don Tabor
1,659 - (25.90 %)Joseph Archibald
325 - (5.07 %)Danny Melvin
88 - (1.37 %)Murray Scott Hants East Todd Williams
1,567 - (16.82 %)John MacDonell
6,052 - (64.96 %)Maurice Rees
1,467 - (15.75 %)Emerich Winkler
231 - (2.48 %)John MacDonell Truro-Bible Hill Hughie MacIsaac
2,544 - (30.23 %)Lenore Zann
4,070 - (48.37 %)Bob Hagell
1,643 - (19.52 %)Kaleigh Brinkhurst
158 - (1.88 %)Jamie Muir† Central Halifax
Electoral District Candidates Incumbent PC NDP Liberal Green Other Halifax Chebucto David Atchison
544 - (6.91 %)Howard Epstein
4,446 - (56.47 %)Jane Spurr
2,535 - (32.20 %)Chris Hanlon
348 - (4.42 %)Howard Epstein Halifax Citadel Ted Larsen
1,000 - (12.99 %)Leonard Preyra
3,785 - (49.17 %)Gerry Walsh
2,584 - (33.57 %)Ryan Watson
329 - (4.27 %)Leonard Preyra Halifax Clayton Park Debbie Hum
1,084 - (10.56 %)Linda Power
3,924 - (38.24 %)Diana Whalen
5,030 - (49.02 %)Amanda Hester
172 - (1.68 %)Jonathan Dean
51 - (0.50 %)Diana Whalen Halifax Fairview Paul Henderson
893 - (12.16 %)Graham Steele
4,680 - (63.71 %)Brad Armitage
1,544 - (21.02 %)Jane Hester
229 - (3.12 %)Graham Steele Halifax Needham Jason Cameron
536 - (6.76 %)Maureen MacDonald
5,336 - (67.30 %)Graham Estabrooks
1,690 - (21.31 %)Kris MacLellan
367 - (4.63 %)Maureen MacDonald Suburban Halifax
Electoral District Candidates Incumbent PC NDP Liberal Green Other Bedford-Birch Cove Len Goucher
2,268 - (20.75 %)Brian Mosher
3,552 - (32.50 %)Kelly Regan
4,861 - (44.48 %)Neil Green
248 - (2.27 %)Len Goucher Halifax Atlantic Brian Phillips
965 - (11.22 %)Michèle Raymond
5,243 - (61.09 %)Jim Hoskins
2,003 - (23.29 %)Anthony Rosborough
378 - (4.40 %)Michele Raymond Hammonds Plains-Upper Sackville Barry Barnet
2,218 - (23.05 %)Mat Whynott
4,815 - (50.03 %)Patrick Doyle
2,381 - (24.74 %)Shawn Redmond
210 - (2.18 %)Barry Barnet Sackville-Cobequid Jessica Alexander
976 - (12.46 %)Dave Wilson
5,120 - (65.34 %)Scott Hemming
1,548 - (19.75 %)Ian Charles
192 - (2.45 %)Dave Wilson Timberlea-Prospect Gina Byrne
795 - (9.10 %)Bill Estabrooks
6,174 - (70.70 %)Lisa Mullin
1,535 - (17.58 %)Tom Trappenberg
229 - (2.62 %)Bill Estabrooks Waverley-Fall River-Beaver Bank Gary Hines
1,696 - (18.45 %)Percy Paris
5,007 - (54.47 %)Bill Horne
2,290 - (24.91 %)Damon Loomer
199 - (2.16 %)Percy Paris Dartmouth/Cole Harbour/Eastern Shore
Electoral District Candidates Incumbent PC NDP Liberal Green Other Cole Harbour Mike Josey
939 - (11.05 %)Darrell Dexter
5,849 - (68.82 %)Tony Ince
1,509 - (17.76 %)Donna Toews
202 - (2.38 %)Darrell Dexter Cole Harbour-Eastern Passage Lloyd Jackson
1,074 - (15.90 %)Becky Kent
4,402 - (65.17 %)Orest Ulan
1,054 - (15.60%)Denise Menard
225 - (3.33 %)Becky Kent Dartmouth East Bert Thompson
873 - (9.66 %)Joan Massey
3,908 - (42.95 %)Andrew Younger
4,133 - (45.43 %)Anna Mukpo
184 - (2.02%)Joan Massey Dartmouth North David Losey
568 - (7.95 %)Trevor Zinck
4,053 - (56.75 %)Jim Smith
2,316 - (32.43 %)Alex Donaldson
205 - (2.87 %)Trevor Zinck Dartmouth South-Portland Valley George Jordan
1,389 - (13.58 %)Marilyn More
5,583 - (54.59 %)Colin Hebb
2,946 - (28.8 %)David Croft
310 - (3.03 %)Marilyn More Eastern Shore Bill Dooks
2,557 - (34.69 %)Sid Prest
3,628 - (49.22 %)Loretta Halleran
992 - (13.46 %)Michael Marshall
194 - (2.63 %)Bill Dooks Preston Dwayne Provo
1,076 - (24.83 %)Janet Sutcliffe
1,314 - (30.33 %)Keith Colwell
1,888 - (43.57 %)Sarah Densmore
55 - (1.27 %)Keith Colwell Central Nova
Electoral District Candidates Incumbent PC NDP Liberal Green Other Antigonish Angus MacIsaac
3,613 - (38.08 %)Maurice Smith
3,338 - (35.18 %)Miles Tompkins
2,378 - (25.06 %)Rebecca Mosher
160 - (1.69 %)Angus MacIsaac Guysborough-Sheet Harbour Ron Chisholm
1,750 - (24.96 %)Jim Boudreau
3,621 - (51.64 %)Lloyd Hines
1,558 - (22.22 %)Amy Florian
83 - (1.18 %)Ron Chisholm Pictou Centre Pat Dunn
3,519 - (44.64 %)Ross Landry
3,650 - (46.3 %)Neil MacIsaac
567 - (7.19 %)Jim Lindsey
147 - (1.86 %)Pat Dunn Pictou East J. Ed. MacDonald
1,984 - (25.94 %)Clarrie MacKinnon
4,893 - (63.98 %)Francois Rochon
642 - (8.39 %)Robbie White
129 - (1.69 %)Clarrie MacKinnon Pictou West Leonard Fraser
1,466 - (19.99 %)Charlie Parker
4,226 - (57.63 %)Paul Landry
1,471 - (20.06 %)Chelsea Richardson
170 - (2.32 %)Charlie Parker Cape Breton
Electoral District Candidates Incumbent PC NDP Liberal Green Other Cape Breton Centre Chris Ryan
479 - (7.33 %)Frank Corbett
5,096 - (80.14 %)Joe MacPherson
685 - (10.77 %)Chris Alders
99 - (1.56 %)Frank Corbett Cape Breton North Cecil Clarke
3,477 - (44.47 %)Russell MacDonald
3,312 - (42.36 %)Ken Jardine
921 - (11.78 %)Chris Milburn
108 - (1.38 %)Cecil Clarke Cape Breton Nova Cory Hann
276 - (4.14 %)Gordie Gosse
4,735 - (71.07 %)Donnie Morrison
1,549 - (23.25 %)Michael Milburn
102 - (1.53 %)Gordie Gosse Cape Breton South Steve Tobin
1,387 - (15.12 %)Wayne McKay
3,332 - (36.33 %)Manning MacDonald
4,278 - (46.65 %)Cathy Theriault
174 - (1.9 %)Manning MacDonald Cape Breton West Alfie MacLeod
3,962 - (43.47 %)Delton MacDonald
2,797 - (30.69 %)Josephine Kennedy
2,212 - (24.27 %)Michael Parsons
174 - (1.9 %)Alfie MacLeod Glace Bay Tom MacPherson
810 - (11.41 %)Myrtle Campbell
2,829 - (39.84 %)David Wilson
3,380 - (47.6 %)Todd Pettigrew
82 - (1.15 %)David Wilson Inverness Rodney MacDonald
5,402 - (56.17 %)Michael MacIsaac
1,971 - (20.49 %)Shaun Bennett
1,905 - (19.81 %)Nathalie Arsenault
339 - (3.53 %)Rodney MacDonald Richmond John Greene
1,045 - (17.92 %)Clair Rankin
1,477 - (25.33 %)Michel Samson
3,228 - (55.36 %)John Percy
81 - (1.39 %)Michel Samson Victoria-The Lakes Keith Bain
2,417 - (38.68 %)Fraser Patterson
1,680 - (26.88 %)Gerald Sampson
1,912 - (30.6 %)James V. O'Brien
143 - (2.29 %)Stemer MacLeod
97 - (1.55 %)Keith Bain Shifts in control
Progressive Conservative to NDP
Electoral District Candidates Incumbent PC NDP Kings North 2006 Mark Parent 2009 Jim Morton Mark Parent Kings South 2006 David Morse 2009 Ramona Jennex David Morse Chester-St. Margaret's 2006 Judy Streatch 2009 Denise Peterson-Rafuse Judy Streatch Lunenburg 2006 Peter Zwicker 2009 Pam Birdsall (vacant) Lunenburg West 2006 Carolyn Bolivar-Getson 2009 Gary Ramey Carolyn Bolivar-Getson Colchester-Musquodoboit Valley 2006 Steve Streatch 2009 Gary Burrill Brooke Taylor Truro-Bible Hill 2006 Hughie MacIsaac 2009 Lenore Zann Jamie Muir Hammonds Plains-Upper Sackville 2006 Barry Barnet 2009 Mat Whynott Barry Barnet Eastern Shore 2006 Bill Dooks 2009 Sid Prest Bill Dooks Guysborough-Sheet Harbour 2006 Ron Chisholm 2009 Jim Boudreau Ron Chisholm Pictou Centre 2006 Pat Dunn 2009 Ross Landry Pat Dunn Independent to NDP
Electoral District Candidates Incumbent Other NDP Cumberland North 2007 Ernest Fage 2009 Brian Skabar Ernest Fage Progressive Conservative to Liberal
Electoral District Candidates Incumbent PC Liberal Bedford-Birch Cove 2006 Len Goucher 2009 Kelly Regan Len Goucher NDP to Liberal
Electoral District Candidates Incumbent NDP Liberal Dartmouth East 2006 Joan Massey 2009 Andrew Younger Joan Massey References
- ^ "Nova Scotia goes to the polls June 9". The Globe and Mail, May 5, 2009.
- ^ "Ready to vote? Nova Scotia's minority Tory government falls". cbc.ca, May 4, 2009.
- ^ [1], CBC, June 9, 2009.
- ^ [2], additional text.
Bibliography
- Government of Nova Scotia. "Election Summary From 1867 - 2006" (PDF). Elections Statistics. Elections Nova Scotia. http://electionsnovascotia.ns.ca/results/ele_summary.pdf. Retrieved 2006-12-02.
External links
- Elections Nova Scotia
- CBC: Nova Scotia Votes 2009
- Election Almanac - Nova Scotia Provincial Election 2009
- [5] - Chronicle Herald
- [6]
 Elections and referendums in Nova Scotia
General elections Referendums 1929 · 2004 Elections in Canada
Most recent Future elections Lists Electoral districts - Federal
- BC
- AB
- SK
- MB
- ON
- QC
- NB
- NS
- PE
- NL
- YU
- NT
- NU
 The Politics of Canada portal
Politics of Nova Scotia The Crown Sovereign • Queen Elizabeth II
Lieutenant-Governor Premier Opposition Leader House of Assembly Current members • Past General AssembliesSpeaker of the Assembly Political parties Elections 2009 general election • Past electionsCurrent issues: Other provinces and territories Categories:- Elections in Nova Scotia
- 2009 elections in Canada


Wikimedia Foundation. 2010.