- List of Ontario general elections
-
This article provides a summary of results for the general elections to the Canadian province of Ontario's unicameral legislative body, the Legislative Assembly of Ontario. The number of seats has varied over time, from 82 for the first election in 1867, to a high of 130 for 1987, 1990 and 1995 elections. There are currently 107 seats. Starting from the 2003 election, Ontario elections are held every 4 years in October.
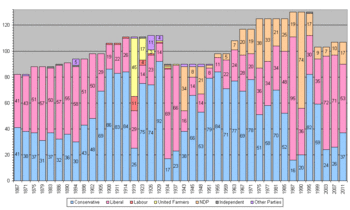
The chart on the left shows the information graphically, with the most recent elections towards the right. It shows how the Liberal Party (red) dominated the first 40 years of provincial politics, winning nine elections in a row. However, the Conservative Party (blue) have won twenty-one of the twenty-nine elections from 1903, including twelve in a row from 1943 to 1981. The one-off wins of the New Democrats (orange) and the United Farmers (green) can also be seen.
This article only covers elections since the Canadian confederation in 1867, when Ontario was created as one of Canada's provinces. For Ontario's first 13 elections as Upper Canada from 1792 to 1840, see Legislative Assembly of Upper Canada. For the eight joint elections of Ontario and Quebec as the Province of Canada, from 1840 to 1867, see list of elections in the Province of Canada.
Summary of results
The table below shows the total number of seats won by the major political parties at each election. The winning party's total is shown in bold. Full details on any election are linked via the year of the election at the start of the row.
Year Conservative [A] Liberal [B] Labour United Farmers [C] NDP [D] Independent Other Total seats 2011 37 53 17 107 2007 26 71 10 107 2003 24 72 7 103 1999 59 35 9 103 1995 82 30 17 1 130 1990 20 36 74 130 1987 16 95 19 130 1985 52 48[E] 25 125 1981 70 34 21 125 1977 58 34 33 125 1975 51 36 38 125 1971 78 20 19 117 1967 69 28 20 117 1963 77 24 7 108 1959 71 22 5 98 1955 84 11 3 98 1951 79 8 2 1 Labour-Progressive 90 1948 53 14 21 2 Labour-Progressive 90 1945 66 14 8 2 Labour-Progressive 90 1943 38 16 34 2 Labour-Progressive 90 1937 23 66 1 90 1934 17 69 1 1 1 1 90 1929 92 14 1 1 4 Progressive 112 1926 74 23 1 3 11 Progressive 112 1923 75 14 4 17 1 111 1919 25 29 11 45 1 Soldier 111 1914 84 26 1 111 1911 83 22 1 106 1908 86 19 1 106 1905 69 29 98 1902 48 50 98 1898 43 51 94 1894 30 58 1 5 Patrons of Industry (3);
P.P.A. (2)94 1890 36 55 91 1886 32 57 1 90 1883 37 50 1 88 1879 31 57 88 1875 37 51 88 1871 38 43 1 Conservative-Liberal 82 1867 41 41 82 Ontario 
This article is part of the series:
Politics and government of
Ontario- Monarch
- Lieutenant-Governor (List)
- David C. Onley
- Premier (List)
- Opposition Leader
- Speaker of the Assembly
- Legislative Assembly (List)
- Cabinet
- Political parties
- Liberals
- Progressive Conservatives
- New Democrats
- General elections
- Current issues
- Other Canadian politics

