- 2005–06 Australian region cyclone season
-
2005–06 Australian region cyclone season 
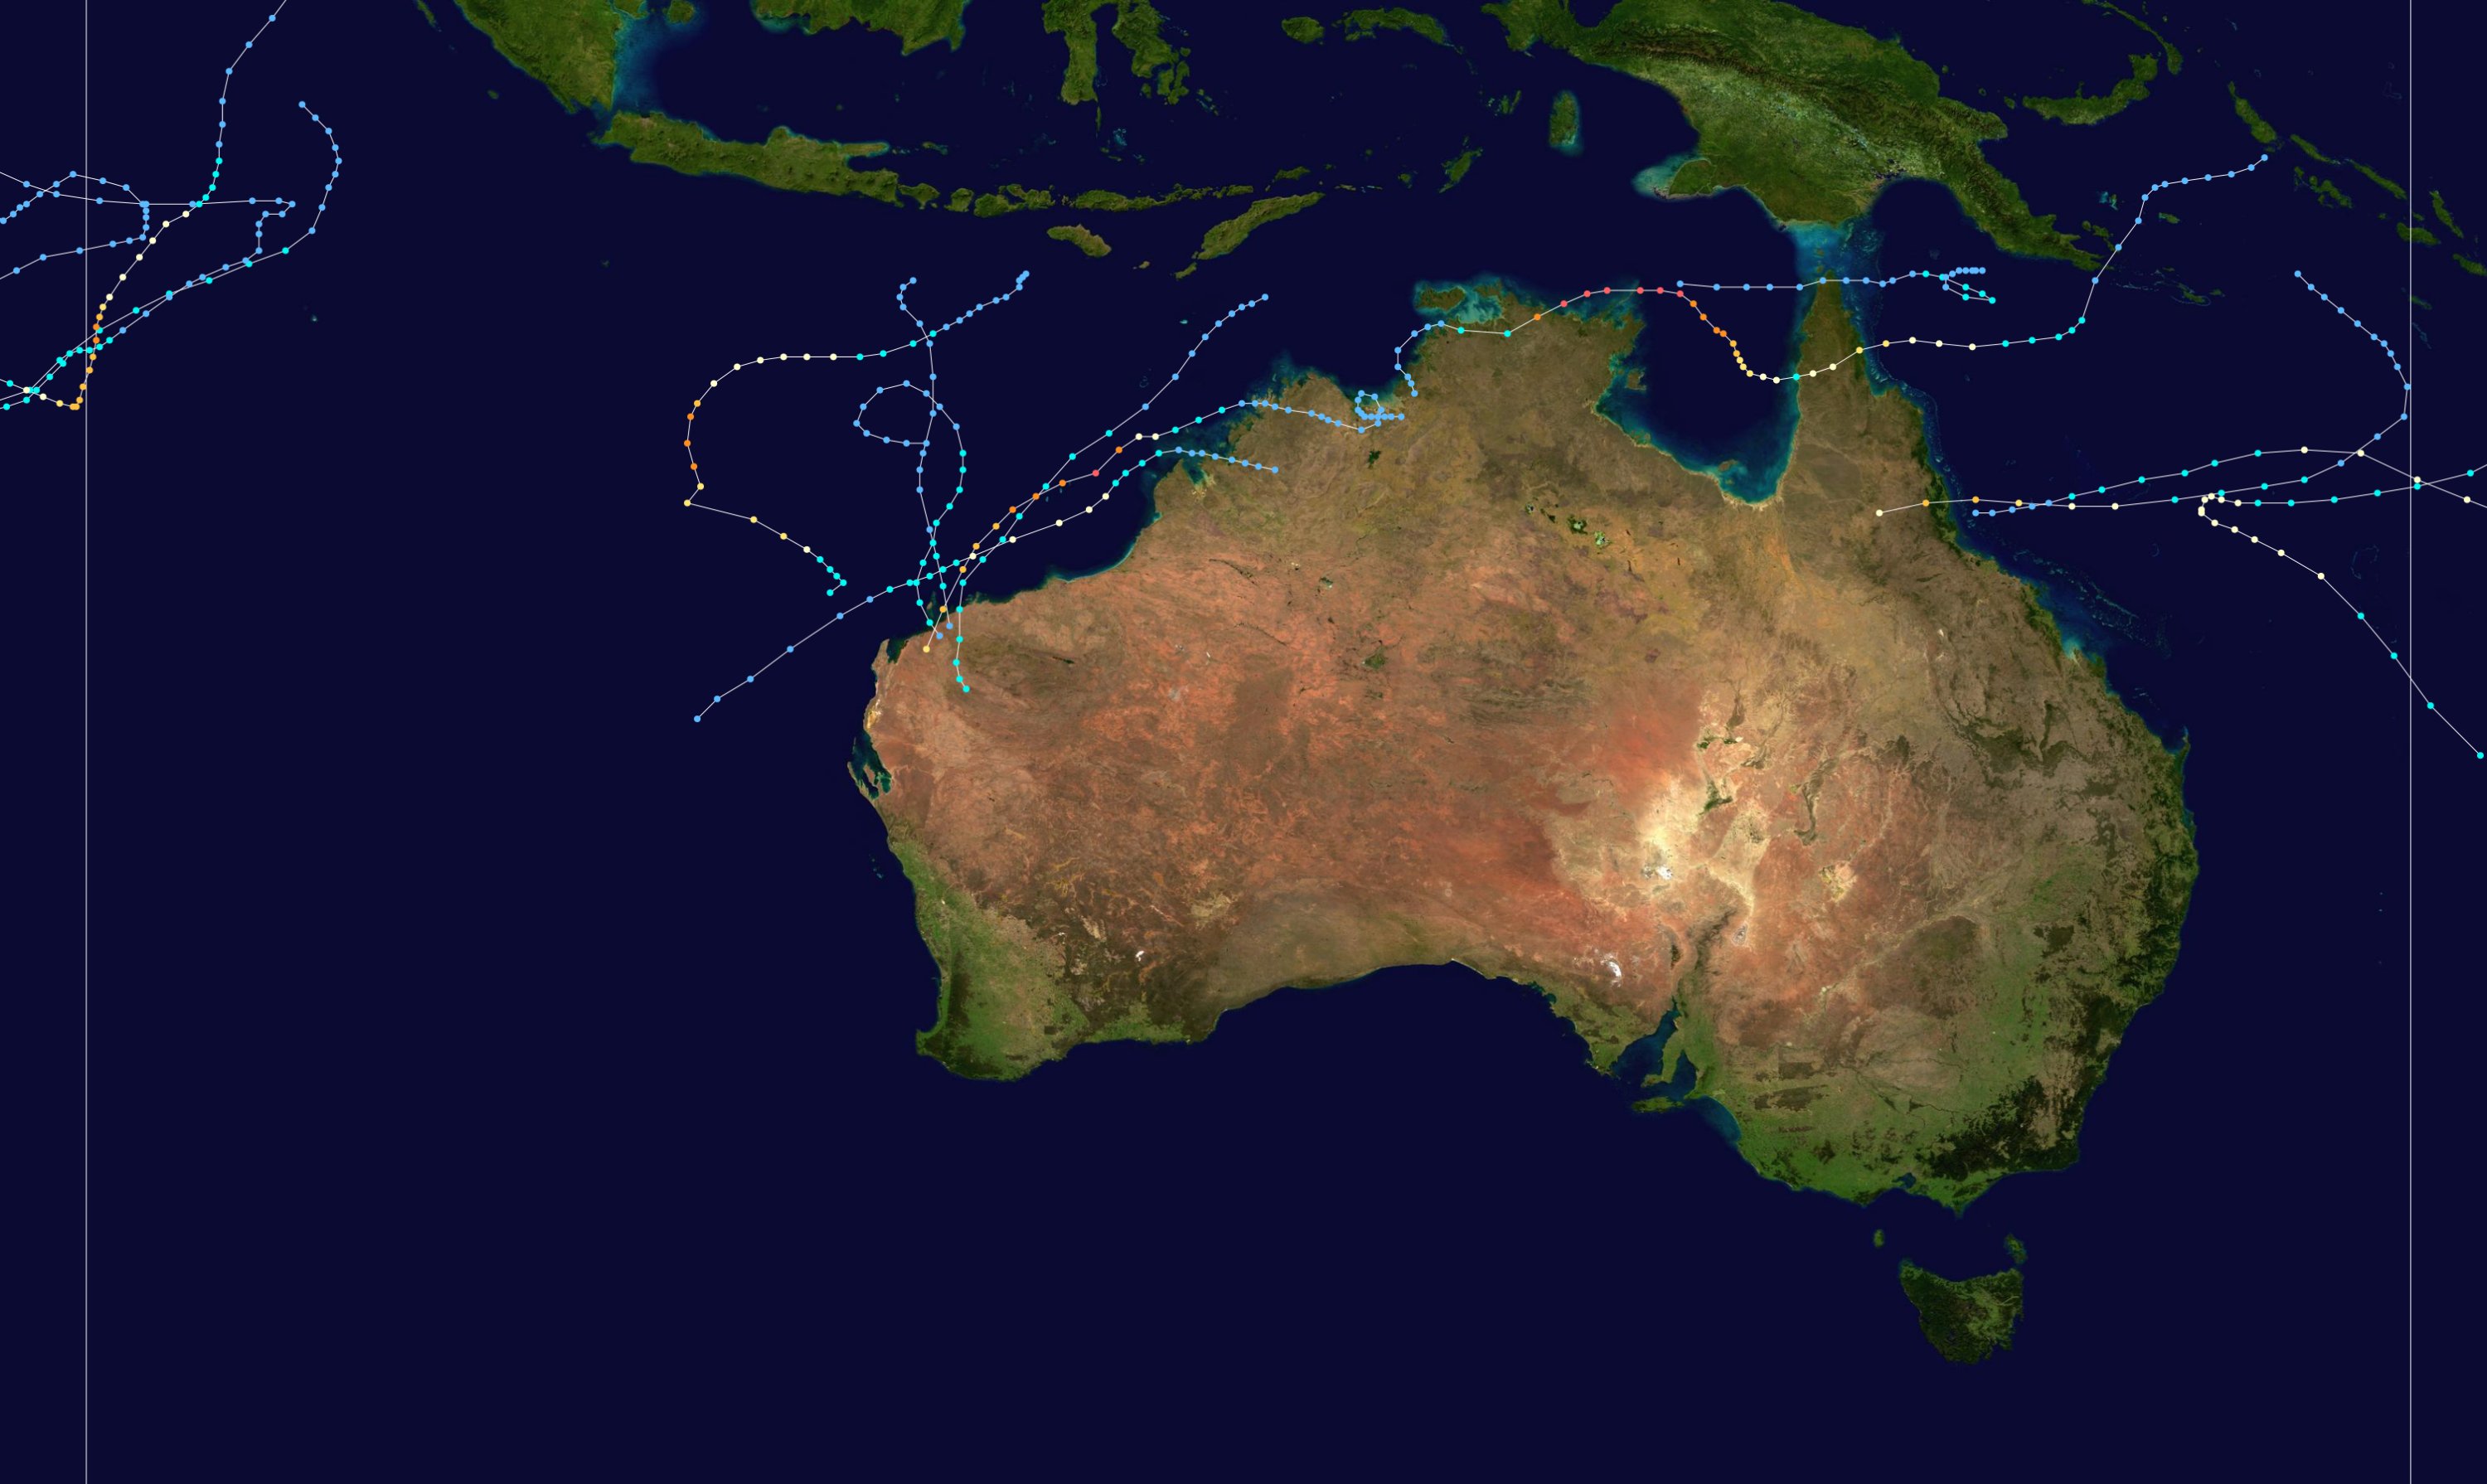
Season summary mapFirst storm formed: 5 November 2005 Last storm dissipated: 26 April 2006 Strongest storm: Glenda – 910 hPa (mbar), 215 km/h (130 mph) (10-minute sustained) Tropical lows: 17 Total storms: 14 Tropical cyclones: 9 Total fatalities: 1 indirect Total damage: $808 million (2006 USD) Australian region cyclone seasons
2003–04, 2004–05, 2005–06, 2006–07, 2007–08Related articles: The 2005–06 Australian region cyclone season was an event in the ongoing cycle of tropical cyclone formation. It began on 1 November 2005 and ended on 30 April 2006. The regional tropical cyclone operational plan also defines a tropical cyclone year separately from a tropical cyclone season, which runs from 1 July 2005 to 30 June 2006.
Tropical cyclones in this area are monitored by four Tropical Cyclone Warning Centres (TCWCs): the Australian Bureau of Meteorology in Perth, Darwin, and Brisbane; and TCWC Port Moresby in Papua New Guinea.[1]
Storms

Tropical Low (02S)
Tropical low (Australian scale) Tropical storm (SSHS) 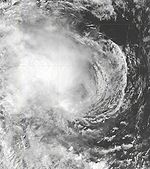

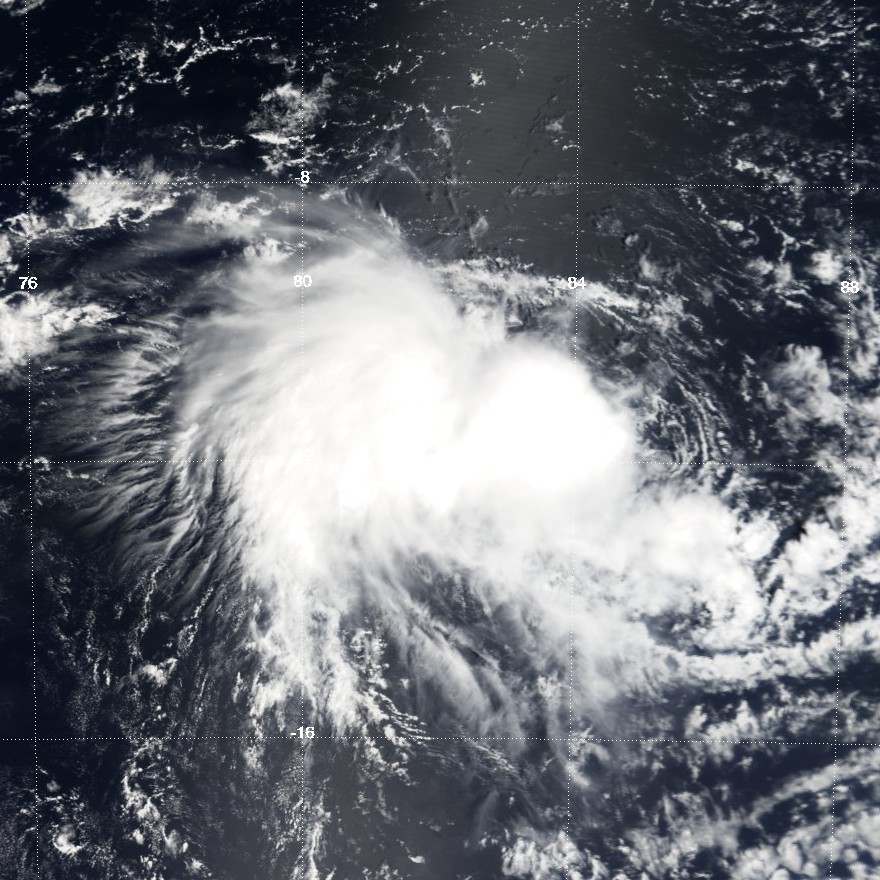
Duration 5 November – 6 November (out of area) Intensity 55 km/h (35 mph) (10-min), 995 mbar (hPa) An area of convection persisted on 4 November about 560 km (345 mi) north of the Cocos Islands, associated with a tight low-level circulation. With good outflow and moderate but decreasing wind shear, conditions favored development.[2] By early on 5 November, the system consisted of a partially exposed circulation with deep convection on its western side, tracking southwestward.[3] At 0400 UTC that day, the Tropical Cyclone Warning Centre (TCWC) in Perth issued a gale warning in association with the disturbance. Later in the day, the Joint Typhoon Warning Center (JTWC) classified it as Tropical Cyclone 02S, and both the JTWC and TCWC Perth anticipated further strengthening.[4]
Throughout its duration, TCWC Perth maintained the system as a 55 km/h (35 mph) tropical low.[5] However, the JTWC assessed the storm as reaching peak winds of 85 km/h (50 mph), based on observations indicating the consolidation of convection over the center. The agency forecast the storm to strengthen further; however, by late on 6 November it had begun weakening.[6] Around the same time, the storm crossed into the area of warning responsibility of Météo-France in Réunion (MFR); as such, it was re-designated as Tropical Depression 04. The depression continued southwestward as it slowly weakened. Early on 8 November, the JTWC issued its final warning, and six hours later, the MFR discontinued advisories while it was located about 1485 km (920 mi) southeast of Diego Garcia.[4]
Severe Tropical Cyclone Bertie-Alvin
Category 4 severe tropical cyclone (Australian scale) Category 4 tropical cyclone (SSHS) 

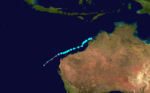
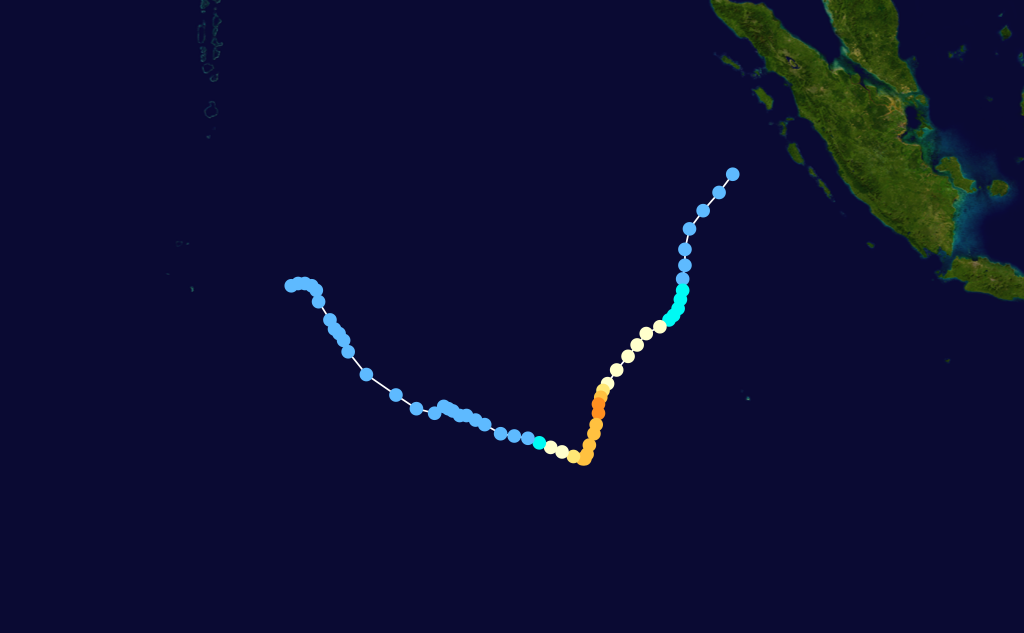
Duration 19 November – 24 November (out of area) Intensity 185 km/h (115 mph) (10-min), 928 mbar (hPa) A weak tropical low persisted on 17 November at a low latitude about 740 km (460 mi) west-southwest of the Indonesia island of Sumatra. Early on 18 November, the TCWC Perth issued a gale warning on the system;[4] at the time, the system consisted of cycling convection in association with several small circulations.[7] The circulations organized into a well-defined center of circulation, and at 0000 UTC on 19 November it was classified as Tropical Cyclone Bertie about 835 km (515 mi) northwest of the Cocos Islands. The storm tracked southwestward around the western periphery of a mid-level ridge between Australia and Indonesia.[4] Environmental conditions generally favored further strengthening, with good outflow though moderate wind shear,[8] and late on 19 November the JTWC initiated advisories on Bertie.[9]
Tropical Cyclone Bertie gradually strengthened and became a Severe Tropical Cyclone on 21 November. The next day, TCWC Perth issued its last advisory on the cyclone, as it was expected to cross 90ºE, which is dividing longitude line between TCWC Perth and the Météo-France (MFR) area of warning responsibility. However, Bertie turned due southward, and the MFR issued advisories for 30 hours as the cyclone remained just east of 90ºE, during which the MFR estimated Bertie attained peak winds of 185 km/h (115 mph). Early on 23 November, the JTWC assessed the cyclone as reaching winds of 210 km/h (135 mph), which equates to a marginal Category 4 on the Saffir-Simpson hurricane scale. On 24 November, the cyclone crossed into the area of responsibility of the MFR, and it was renamed Intense Tropical Cyclone Alvin. Shortly thereafter the storm turned to a northwest drift, and encountering unfavorable conditions, Alvin rapidly weakened. The JTWC issued its last advisory on 26 November after it weakened to a tropical depression, and two days later the MFR discontinued advisories.[4] The remnants of the storm continued northwestward until turning west-southwestward and dissipating on 3 December.[10]
Tropical Low (04S)
Tropical low (Australian scale) 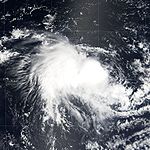

Duration 21 December – 23 December (out of area) Intensity 55 km/h (35 mph) (10-min), 998 mbar (hPa) A tropical low persisted on 19 December just west of 90ºE, which is just outside of the area of warning responsibility of TCWC Perth.[11] The system initially consisted of pulsating convection in association with an elongated and partially-exposed low-level circulation.[12] TCWC Perth began issuing gale warnings on the system on 22 December as the low tracked southeastward.[11] Moderate wind shear persisted over the system, preventing immediate development[13] The low turned southwestward, and on 23 December it entered the area of responsibility of Météo-France in Réunion (MFR).[11]
Upon entering the South-West Indian Ocean, the MFR classified the system as Tropical Depression 06. Convection increased and organized, and the JTWC initiated advisories on Tropical Cyclone 04S on 24 December. However, wind shear increased shortly thereafter, resulting in weakening. On 25 December, the JTWC discontinued advisories, and a day later the MFR followed suit. The remnants tracked southwestward, and the MFR again issued advisories starting on 27 December. After passing near Rodrigues, the system weakened again due to persistent vertical shear, and on 29 December the MFR again issued the final warning on the system.[11]
Severe Tropical Cyclone Clare
Main article: Cyclone ClareCategory 3 severe tropical cyclone (Australian scale) Tropical storm (SSHS) 
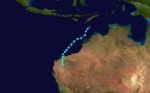
Duration 6 January – 10 January Intensity 140 km/h (85 mph) (10-min), 960 mbar (hPa) A tropical low formed north of Northern Territory and tracked roughly parallel to the coast. On 7 January, TCWC Perth started issuing tropical cyclone advisories on this system. The low became Tropical Cyclone Clare when it was located 250 km north of Cape Leveque or 430 km north of Broome. A steady strengthening trend continued and Clare peaked as a 139 km/h (75 kt) storm, or a Category 3 cyclone on the Australian scale, with a minimum pressure of 960 hPa at the centre of the system. On 9 January the cyclone made landfall near Karratha and Dampier next day, and dissipated on the 10th as it continued inland. On 12 December 2006, the Bureau of Meteorology announced that the name "Clare" would be retired, and will never be used for an Australian Cyclone ever again.[14]
In preparation of the storm, 1,500 people were evacuated, while incoming flights and mining operations were closed. [15] Although sustained wind speeds of 131 km/h and gusts of up to 142 km/h were recorded, the towns affected by TC Clare escaped with only minor structural damage. The precipitation associated with Ex-Tropical Cyclone Clare caused extensive flooding in the towns of Walkaway and Lake Grace over the weekend of 14–15 January. [16] Because it made landfall at low tide, storm surge damage was negligible. [17] Overall, damage was estimated to be at least A$5 million ($3.2 million USD),[18] and Clare was responsible for no deaths.
Tropical Cyclone Daryl
Category 2 tropical cyclone (Australian scale) Tropical storm (SSHS) 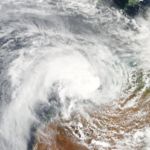
Duration 18 January – 22 January Intensity 100 km/h (65 mph) (10-min), 976 mbar (hPa) On 17 January, TCWC Perth started issuing tropical cyclone advices for a tropical low overland. The low tracked into Kuri Bay next day and developed into Tropical Cyclone Daryl. It continued to strengthen, and on 21 January briefly became a Severe Tropical Cyclone operationally but was downgraded to a 55kt Tropical Cyclone following the end of season analysis. Over the next two days, Daryl tracked parallel to the West Australian coast, mostly as a Category 2 system. Daryl continued tracking in a south-westerly direction before being downgraded to a low-pressure system on 23 January. The cyclone did not cross the coast.
Northern Territory Monsoon Low
Tropical low (Australian scale) 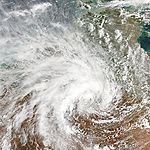
Duration 24 January – 1 February Intensity 55 km/h (35 mph) (10-min), 989 mbar (hPa) A tropical low developed off the north coast of the Top End in late January. It made landfall in the Darwin area and drifted down the western border of the Northern Territory. The low brought heavy falls to many parts of the western Northern Territory. The low continued to move south through the Victoria River District and into the Tanami Desert. The Victoria Highway was cut by floodwaters, isolating Timber Creek and the Victoria River Crossing. On 31 January, the low deepened producing near gale force winds.
- Significant Weather Summaries from Australian Bureau of Meteorology
- A comprehensive discussion of the low
- An animated satellite picture loop for the week 26 January to 1 February
Severe Tropical Cyclone Jim
Category 3 severe tropical cyclone (Australian scale) Category 1 tropical cyclone (SSHS) 

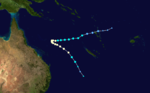
Duration 25 January – 30 January (out of area) Intensity 120 km/h (75 mph) (10-min), 970 mbar (hPa) On 24 January, a broad area of low pressure developed near the coast of Queensland after a monsoonal trough passed through the region. Northeasterly winds flowing into the system quickly increased convection, resulting in heavy rainfall over coastal regions of Queensland. The slow movement of the developing low continued through 26 January before turning northeast in response to a mid-level ridge to the north.[19] On 28 January, the JTWC began monitoring the system as Tropical Storm 10P[20] and shortly after, the Bureau of Meteorology classified the storm as a Category 1 cyclone and gave it the name Jim.[21]
Jim continued to intensify as it steadily tracked east-northeastward. Upper-level outflow associated with the storm gradually improved as the cyclone neared the edge of the Bureau of Meteorology's warning area.[19] Shortly before crossing 160°E on 30 January, Jim intensified into a Category 3 cyclone,[21] with winds reaching 120 km/h (75 mph 10-minute sustained).[22] At the same time, the JTWC assessed the system to have become a Category 1 equivalent with winds of 120 km/h (75 mph 1-minute sustained).[20] After crossing 160°E, warning responsibility of the cyclone was given to the RSMC in Nadi, Fiji.[19] Upon entering their area of responsibility, Jim sharply turned southeast, attaining a peak intensity with winds of 150 km/h (90 mph 10-minute sustained) as it brushed New Caledonia. By 1 February, the storm had transitioned into an extratropical cyclone, dissipating a few days later.[19]
As the storm was developing, torrential rainfall affected portions of coastal Queensland between 26 and 27 January. In a 24-hour span, 258 mm (10.2 in) of rain fell in Home Hill, leading to minor flooding. On 28 January, the cyclone brushed Flinders Reef, Willis Island and Lihou Reef, bringing winds up to 65 km/h (40 mph) to all three areas.[21]
Tropical Cyclone Kate
Category 2 tropical cyclone (Australian scale) Tropical storm (SSHS) 
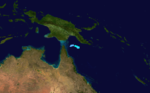
Duration 22 February – 24 February Intensity 95 km/h (60 mph) (10-min), 985 mbar (hPa) Main article: Cyclone Kate (2006)TCWC Brisbane issued a gale warning for a Tropical Low near the northern tip of Cape York Peninsula on 22 February. The low moved in an easterly direction. It quickly strengthened and became Tropical Cyclone Kate on the same day. Kate moved eastwards and weakened into a tropical low on 24 February.
Upon the formation of Kate, the Bureau of Meteorology warned vessels to avoid traveling near the storm due to rough seas and wind gusts up to 125 km/h (78 mph).[23] Although the storm was deemed to have not been a threat to Queensland, officials urged residents to ensure their disaster kits were ready and that preparations for a moderate storm, such as storing lose outdoor objects and clearing gutters, had been completed.[24] Although the storm had no direct impact on land, large swells produced by the system affected most of the Queensland coastline. In the Shire of Noosa, six surfers sustained serious injuries after wading into turbulent waters. Waves up to 1.8 m (5.9 ft) tossed the six surfers, leaving them with injuries ranging from broken noses and fractured ankles to head wounds from surfboards.[25]
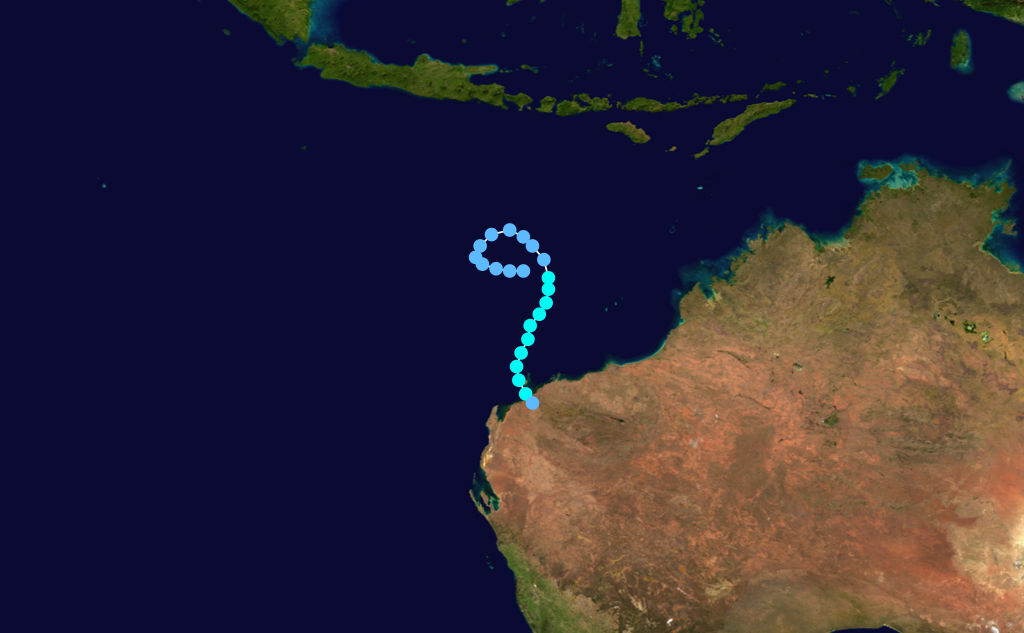
Tropical Cyclone Emma
Category 1 tropical cyclone (Australian scale) Tropical storm (SSHS) 
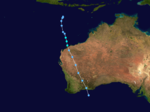
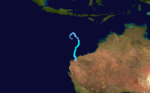
Duration 26 February – 1 March Intensity 75 km/h (45 mph) (10-min), 988 mbar (hPa) Main article: Cyclone EmmaThe ninth storm of the season, Cyclone Emma, originated from a southward-moving area of low pressure that was first identified on 25 February. Although classified tropical, the structure of the system represented that of a monsoonal storm. However, low wind shear and well-developed outflow gradually allowed convection to develop near the center of circulation. As the system near the Pilbara coastline of Western Australia on 27 February,[26] it intensified into a Category 1 cyclone and attained peak winds of 75 km/h (45 mph 10-minute sustained).[22] The JTWC, however, reported the storm to have been slightly weaker, attaining peak winds of 65 km/h (40 mph 1-minute sustained).[27] After moving inland near Mardie, Emma weakened to a tropical low but became exceedingly large, with the cloud cover from the storm encompassing most of Western Australia. The remnants of the weak storm persisted until 1 March, at which time it dissipated over the Great Australian Bight.[26]
Although a weak storm, rainfall from Emma caused flooding in numerous parts of Western Australia.[26] In Karratha, six people required rescue after their cars became stranded in flood waters.[28] The most significant damage took place along the Murchison River which swelled to roughly 16 km (9.9 mi) in width. Although only one town was threatened by the river, large areas of farmland were inundated by the expanding river, leading to substantial agricultural losses.[29][30] Despite the extensive flooding, no fatalities were reported as a result of Emma.[26]
Northern Territory Tropical Low
Tropical low (Australian scale) 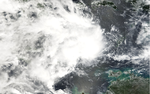
Duration 28 February – 6 March Intensity 55 km/h (35 mph) (10-min), 998 mbar (hPa) A tropical low formed in the Arafura Sea north of Nhulunbuy on 24 February. It moved northwest into the Banda Sea and deepened during the next two days. Through the remainder of February it moved slowly southsouthwest into the Timor Sea. The low persisted into March but did not reach cyclone intensity. A cyclone watch was issued for a portion of Western Australia though the maximum sustained winds of the low were just 25 knots.
- Significant Weather Summaries from Australian Bureau of Meteorology
Severe Tropical Cyclone Larry
Category 5 severe tropical cyclone (Australian scale) Category 4 tropical cyclone (SSHS) 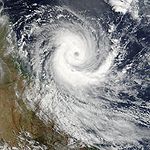

Duration 16 March – 21 March Intensity 205 km/h (125 mph) (10-min), 940 mbar (hPa) Main article: Cyclone LarryTCWC Brisbane issued a gale warning for a Tropical Low in the Coral Sea on 16 March. On the same day, RSMC Nadi classified it as a deepening tropical depression (15F). On 17 March, the tropical low strengthened into Tropical Cyclone Larry. Larry moved towards the Queensland coast and gradually intensified to Category 4 on the Australian scale,[31] making landfall with that strength on 20 March over Innisfail. Larry was downgraded to a tropical low that night.
Cyclone Larry is considered to be the worst cyclone to hit Queensland since 1931. The total damage caused by Larry was estimated to be A$1 billion (2006).
Severe Tropical Cyclone Floyd
Category 4 severe tropical cyclone (Australian scale) Category 4 tropical cyclone (SSHS) 

Duration 20 March – 26 March Intensity 195 km/h (120 mph) (10-min), 915 mbar (hPa) On 21 March, TCWC Perth started issuing advises on a Tropical Low. That low later strengthened to Tropical Cyclone Floyd as a Category 1 on the Australian scale. Overnight on 22 March, it became a severe tropical cyclone. Strengthening further, Floyd reached Australian Category 4 at 8 p.m. AWST (1200 UTC) on 23 March. Floyd attained its peak intensity with maximum sustained winds up to 105 knots (10-minute average) on 24 March. A steady weakening trend occurred thereafter and Floyd became a tropical low about 285 kilometres west northwest of Exmouth on 27 March.
Severe Tropical Cyclone Wati
Category 3 severe tropical cyclone (Australian scale) Category 1 tropical cyclone (SSHS) 
Duration 20 March – 24 March Intensity 155 km/h (100 mph) (10-min), 950 mbar (hPa) Severe Tropical Cyclone Wati originated in the South Pacific region and moved into Brisbane's area of responsibility in late March. It later moved to the south-east where cyclone watches were issued for Lord Howe Island and cyclone warnings for Norfolk Island.
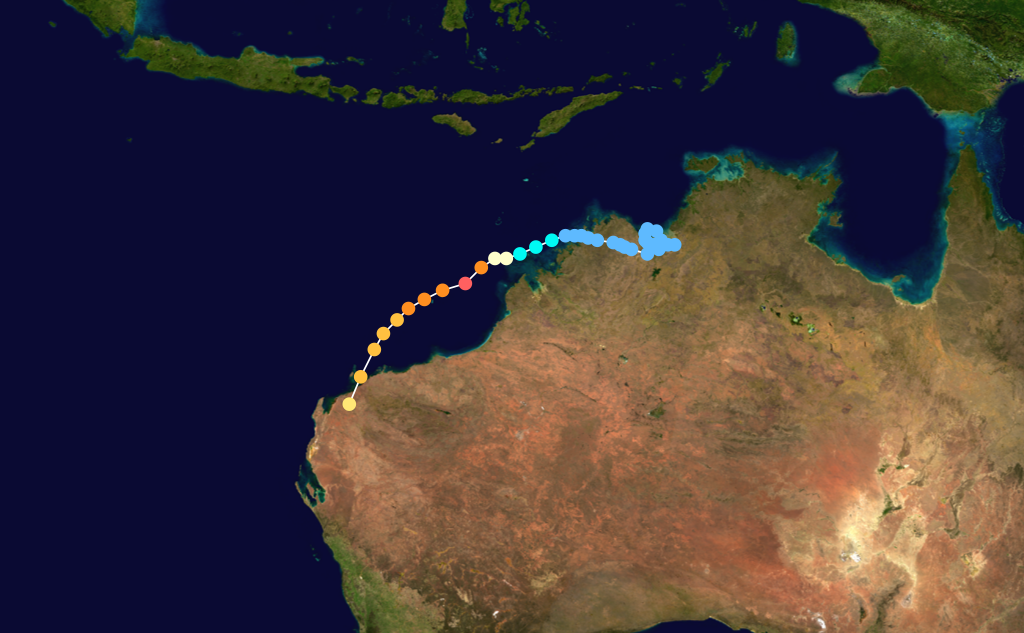
Severe Tropical Cyclone Glenda
Category 5 severe tropical cyclone (Australian scale) Category 4 tropical cyclone (SSHS) 

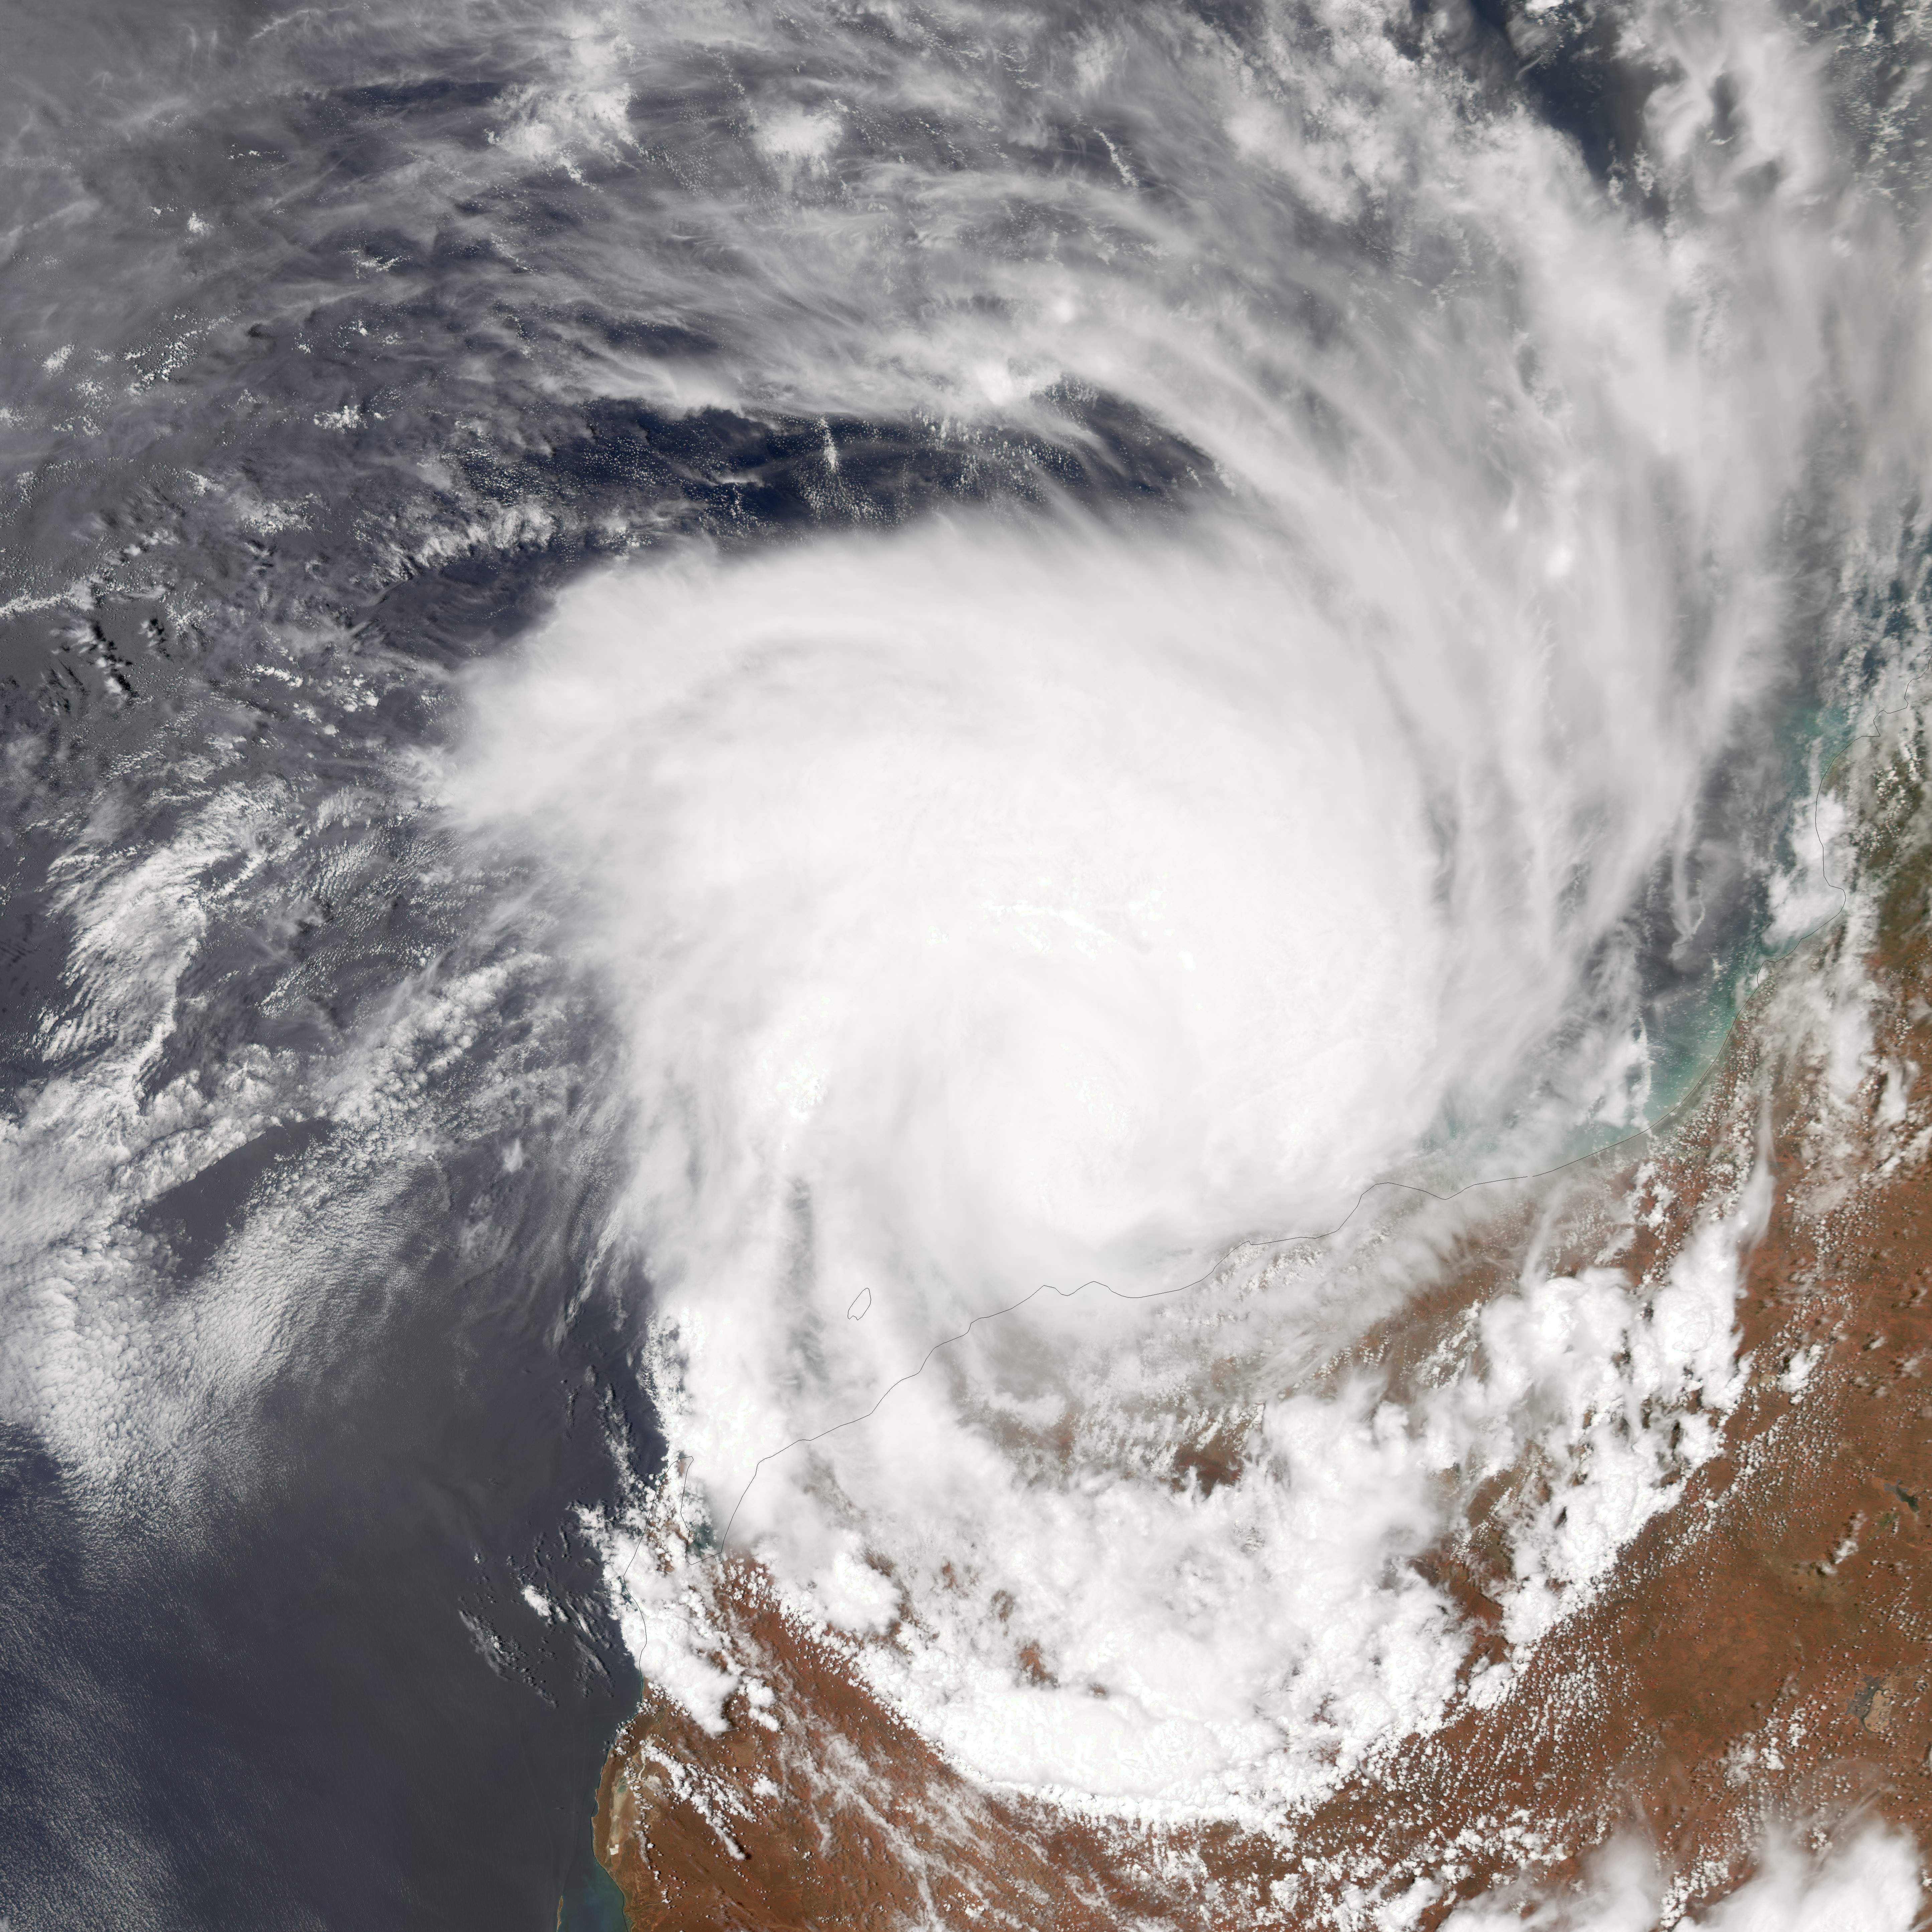
Duration 26 March – 31 March Intensity 205 km/h (130 mph) (10-min), 910 mbar (hPa) Main article: Cyclone GlendaCyclone Glenda began as a tropical low on 15 March in the Gulf of Carpentaria. The precursor disturbance drifted over Top End and later across the northeastern portion of Western Australia, and after emerging into the Indian Ocean it strengthened into a tropical storm. Aided by favourable environmental conditions, Glenda rapidly intensified to reach Category 5 status on the Australian cyclone scale, and with a peak intensity of 910 mbar it was among the strongest cyclones on record within the Australia region. On 30 March, it moved ashore near Onslow as a Category 3 cyclone, and the next day it degenerated into a remnant tropical low over land.[5][32]
The precursor disturbance produced heavy rainfall in the Kimberley region of Western Australia, causing record flooding and some road damage. Minor damage was reported at the final landfall of Glenda. Due to the sparse population and preparations made, the cyclone was not responsible for any deaths or injuries.[33] In all, damages from the storm amounted to A$1.2 million ($965,000 USD).[34] However, its name was later retired from the list of tropical cyclone names.[35]
Cocos Island Tropical Low
Tropical low (Australian scale) 
Duration 26 March – 29 March Intensity 55 km/h (35 mph) (10-min), 994 mbar (hPa) Cocos Islands faced their first cyclone threat this cyclone season on 25 March when a tropical low developed to its east-northeast. The low passed well to their east and did not develop further. The maximum sustained winds near the low were 30 knots and the minimum pressure was 994 hPa.[36]
Tropical Cyclone Hubert
Category 2 tropical cyclone (Australian scale) Tropical storm (SSHS) 
Duration 5 April – 7 April Intensity 95 km/h (60 mph) (10-min), 980 mbar (hPa) TCWC Perth issued a gale warning for a Tropical Low off Northwest Australia on 4 April. The low moved erratically at first, and then towards southwest. It strengthened into Tropical Cyclone Hubert (Australian Category 1) on 5 April and to Australian Category 2 on 6 April. Prior to landfall, Hubert weakened rapidly in an unfavourable atmospheric environment, and the surface circulation was poorly defined. Eventually, Hubert was downgraded to a tropical low with maximum sustained winds to 33 knots as it crossed the coast during the night of 7 April (based on AWST).
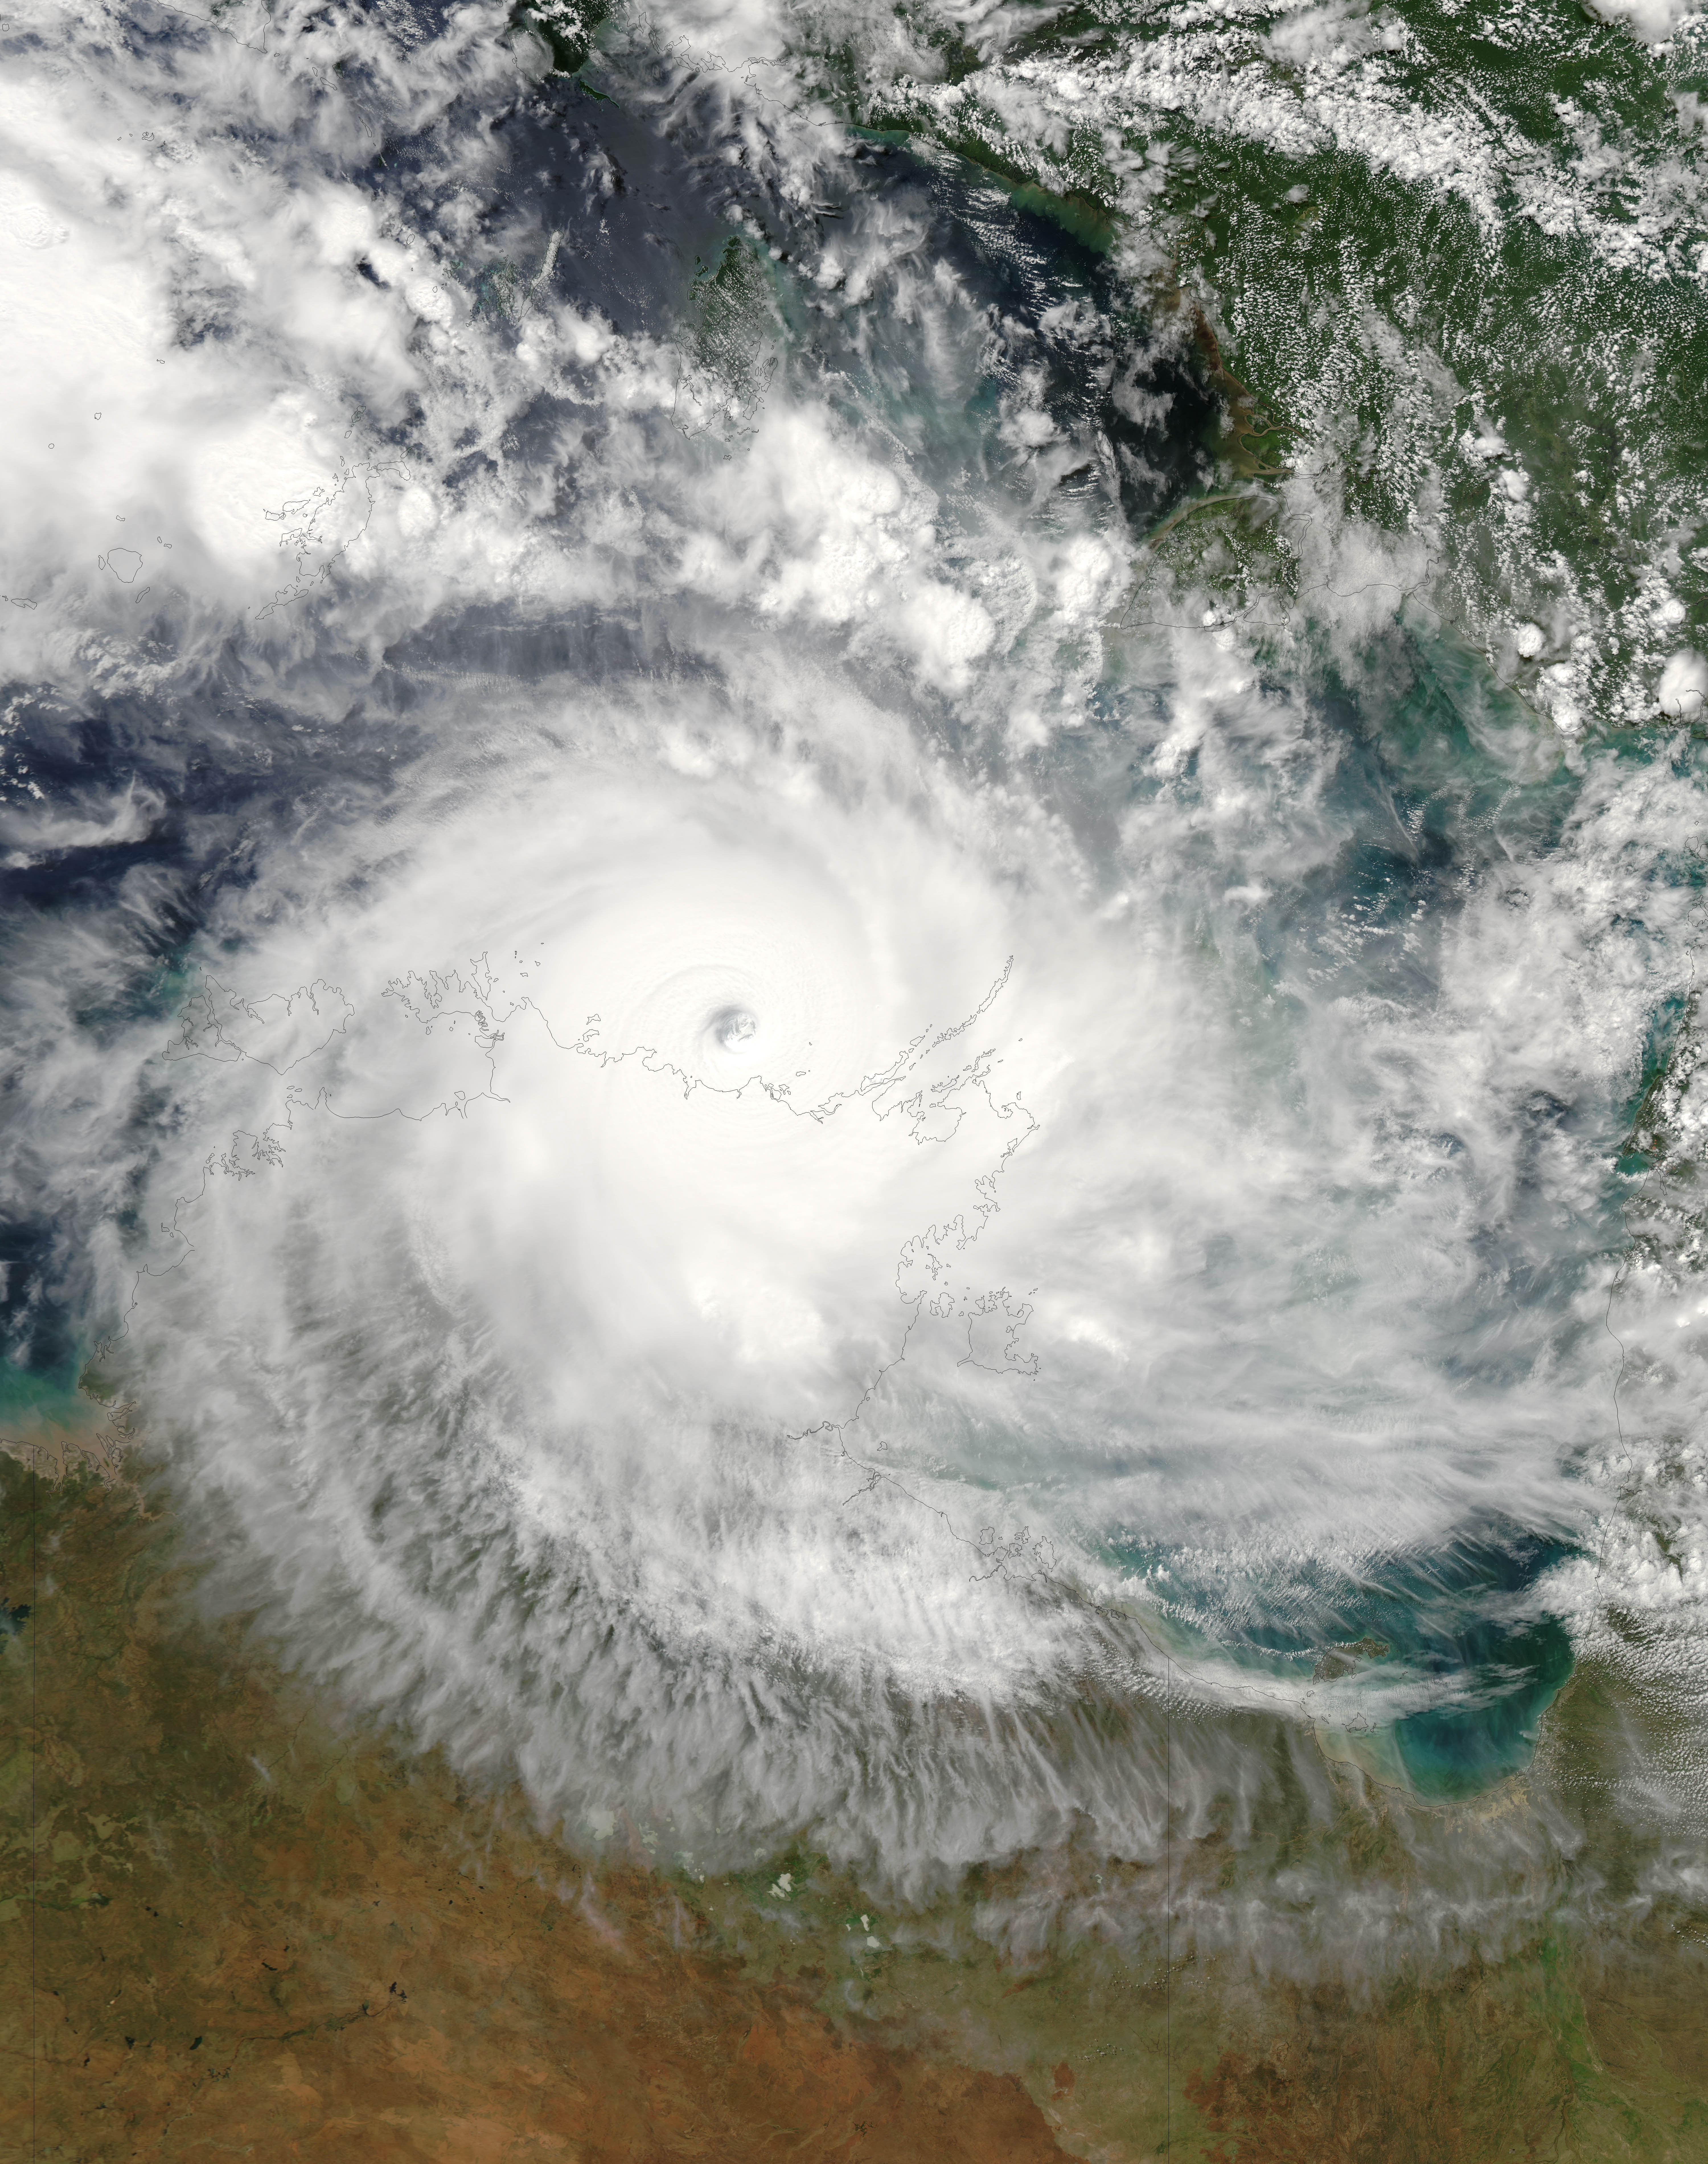
Severe Tropical Cyclone Monica
Category 5 severe tropical cyclone (Australian scale) Category 5 tropical cyclone (SSHS) 

Duration 16 April – 26 April Intensity 250 km/h (155 mph) (10-min), 916 mbar (hPa) Main article: Cyclone MonicaThe final and most intense storm of the season, Monica originated from an area of low pressure off the coast of Papua New Guinea on 16 April.[37] The storm quickly developed into a Category 1 cyclone the next day, at which time it was given the name Monica.[22] Traveling towards the west, the storm intensified into a severe tropical cyclone before making landfall in Far North Queensland, near the Lockhart River, on 19 April. After moving over land, convection associated with the storm quickly became disorganized.[37]
On 20 April, moved over the Gulf of Carpentaria and began to re-intensify.[37] Over the following few days, deep convection formed around a 37 km (23 mi) wide eye.[38] Early on 22 April, the Bureau of Meteorology assessed Monica to have attained Category 5 status, on the Australian cyclone intensity scale.[22] The JTWC also upgraded Monica to a Category 5 equivalent cyclone, on the Saffir–Simpson Hurricane Scale.[39] The storm attained its peak intensity the following day with winds of 250 km/h (155 km/h 10-minute sustained) and a barometric pressure of 916 hPa (mbar).[22] At the same time, the JTWC assessed the storm to have attained winds of 285 km/h (180 mph 1-minute sustained), ranking it as one of the strongest storms ever recorded in the Southern Hemisphere.[39] On 24 April, Monica made landfall about 35 km (22 mi) west of Maningrida, at the same intensity. Rapid weakening took place as the storm moved over land. Less than 24-hours after landfall, the storm had weakened to a tropical low. The remnants of the former-Category 5 cyclone persisted until 28 April over northern Australia.[22][37]
In contrast to the extreme intensity of the cyclone, relatively little structural damage resulted from it.[38] No injuries were reported throughout the storm's existence and losses were estimated to be A$1.6 million ($766,000 USD).[40] However, severe environmental losses took place. In the Northern Territory, about 7,000 km2 (4,349 mi2) of trees were downed by Monica's high wind gusts.[41] In response to the large loss of forested area, it was stated that it would take several hundred years for the area to re-flourish.[42]
Storm names
Tropical cyclones are assigned names by the Australian Bureau of Meteorology or Papua New Guinea.
Tropical cyclones are named if they are non-frontal low pressure systems of synoptic scale developing over warm waters, or Dvorak intensity analysis indicate the presence of gale force or stronger winds near the centre. Therefore, a tropical system with gales in one or more quadrants, but not near the centre, are not named.[43]
All names assigned in the Australian region are used sequentially, unlike lists used annually by the National Hurricane Centre in the Atlantic Ocean and east Pacific Ocean. Only the names used during this cyclone season are listed below. The complete list of names for each basin are found in the World Meteorological Organization's official list.
Southeast Indian Ocean
Tropical cyclones that develop east of 90°E, south of the Equator, and west of 125°E are assigned names by the Tropical Cyclone Warning Centre in Perth, Western Australia.[1]
- Bertie
- Clare
- Daryl
- Emma
- Floyd
- Glenda
- Hubert
Arafura Sea and Western Gulf of Carpentaria
Tropical cyclones that develop south of the Equator between 125°E and 141°E are assigned names by the Tropical Cyclone Warning Centre in Darwin, Northern Territory.[1]
No tropical cyclone names were used in the 2005-06 season.
Coral Sea and Eastern Gulf of Carpentaria
Tropical cyclones that develop south of 10°S between 141°E and 160°E are assigned names by the Tropical Cyclone Warning Centre in Brisbane, Queensland.[1]
Note also that Cyclone Wati from the South Pacific region also affected the area monitored by Brisbane's Tropical Cyclone Warning Centre.
Solomon Sea and Gulf of Papua
Tropical cyclones that develop north of 10°S between 141°E and 160°E are assigned names by the Tropical Cyclone Warning Centre in Port Moresby, Papua New Guinea.[1]
No tropical cyclone names were used in the 2005-06 season.
Season impact
2005-2006 Australian cyclone statistics Storm name Active dates Storm category at peak intensity
Max wind
(mph)
Min. press.
(mbar)
Landfall(s) Damage (millions
USD)
Deaths Where When Wind (mph)
Low 5 November – 8 November Tropical low 35 995 none none 0 Bertie-Alvin 19 November – 24 November Category 4 cyclone 115 928 none none 0 Low 21 December – 23 December Tropical low 35 998 none none 0 Clare 6 January – 10 January Category 3 cyclone 85 960 Karratha, Western Australia 9 January 85 3.2 0 Daryl 18 January – 22 January Category 2 cyclone 65 976 none none 0 Low 24 January – 1 February Tropical low 35 989 none Unknown 0 Jim 27 January – 30 January Category 3 cyclone 75 970 none none 0 Kate 22 February – 24 February Category 2 cyclone 60 985 none none 0 Emma 26 February – 1 March Category 1 cyclone 45 988 Mardie, Western Australia 28 February 45 Unknown 0 Low 28 February – 6 March Tropical low 35 998 none Unknown 0 Larry 16 March – 21 March Category 5 cyclone 125 940 Innisfail, Queensland 20 March 125 800 0 (1) Floyd 20 March – 26 March Category 4 cyclone 120 915 none none 0 Wati 20 March – 24 March Category 3 cyclone 100 950 none none 0 Glenda 23 March – 31 March Category 5 cyclone 130 910 Onslow, Western Australia 30 March 80 0.9 0 Low 26 March – 29 March Tropical low 35 994 none none 0 Hubert 5 April – 7 April Category 2 cyclone 60 980 Onslow, Western Australia 7 April 40 minimal 0 Monica 16 April – 26 April Category 5 cyclone 155 916 Lockhart River, Queensland 19 April 75 5.1 0 Wessel Islands 23 April 155 North of Darwin, Northern Territory 24 April 155 Wadeye, Northern Territory 25 April 30 Season Aggregates 17 cyclones 5 November – 26 April 155 910 9 landfalls ~808.3 0 (1) See also
- List of Southern Hemisphere tropical cyclone seasons
- Atlantic hurricane seasons: 2005, 2006
- Pacific hurricane seasons: 2005, 2006
- Pacific typhoon seasons: 2005, 2006
- North Indian Ocean cyclone seasons: 2005, 2006
References
- ^ a b c d e http://www.wmo.ch/web/www/TCP/TCP24-English2004.pdf
- ^ Charlie Forecast Team (2005). "4 November Significant Tropical Weather Advisory". Joint Typhoon Warning Center. ftp://ftp.met.fsu.edu/pub/weather/tropical/GuamStuff/2005/Nov/2005110409-ABIO.PGTW. Retrieved 26 April 2008.
- ^ Alpha Forecast Team (2005). "5 November Significant Tropical Weather Advisory". Joint Typhoon Warning Center. ftp://ftp.met.fsu.edu/pub/weather/tropical/GuamStuff/2005/Nov/2005110508-ABIO.PGTW. Retrieved 26 April 2008.
- ^ a b c d e Gary Padgett (2005). "November 2005 Worldwide Tropical Cyclone Summary". http://www.australiasevereweather.com/cyclones/2006/summ0511.htm. Retrieved 26 April 2008.
- ^ a b Gary Padgett (2006). "March 2006 Worldwide Tropical Cyclone Summary". http://www.australiasevereweather.com/cyclones/2006/summ0603.htm. Retrieved 13 April 2008.
- ^ Joint Typhoon Warning Center (2005). "Advisories for Tropical Cyclone 02S". http://www.australiasevereweather.com/cyclones/2006/tropical_cyclone_200602.htm. Retrieved 26 April 2008.
- ^ Delta Forecast Team (2005). "18 November Significant Tropical Weather Advisory". Joint Typhoon Warning Center. ftp://ftp.met.fsu.edu/pub/weather/tropical/GuamStuff/2005/Nov/2005111809-ABIO.PGTW. Retrieved 30 April 2008.
- ^ Bravo Forecast Team (2005). "19 November Significant Tropical Weather Advisory". Joint Typhoon Warning Center. ftp://ftp.met.fsu.edu/pub/weather/tropical/GuamStuff/2005/Nov/2005111910-ABIO.PGTW. Retrieved 30 April 2008.
- ^ Alpha Forecast Team (2005). "19 November Significant Tropical Weather Advisory (2)". Joint Typhoon Warning Center. ftp://ftp.met.fsu.edu/pub/weather/tropical/GuamStuff/2005/Nov/2005111921-ABIO.PGTW. Retrieved 30 April 2008.
- ^ Météo France (2007). "Cyclone tropical intense: Alvin (Période du 18/11/2005 au 03/12/2005)" (in French). Archived from the original on 12 January 2008. http://web.archive.org/web/20080112135025/http://www.meteo.fr/temps/domtom/La_Reunion/TGPR/saisonprecedente/01.html. Retrieved 30 April 2008.
- ^ a b c d Gary Padgett (2005). "December 2005 Worldwide Tropical Cyclone Summary". http://www.australiasevereweather.com/cyclones/2006/summ0512.htm. Retrieved 9 May 2008.
- ^ Alpha Forecast Team (2005). "18 December Significant Tropical Weather Advisory". Joint Typhoon Warning Center. ftp://ftp.met.fsu.edu/pub/weather/tropical/GuamStuff/2005/Dec/2005121818-ABIO.PGTW. Retrieved 9 May 2008.
- ^ Alpha Forecast Team (2005). "22 December Significant Tropical Weather Advisory". Joint Typhoon Warning Center. ftp://ftp.met.fsu.edu/pub/weather/tropical/GuamStuff/2005/Dec/2005122218-ABIO.PGTW. Retrieved 9 May 2008.
- ^ Tropical Cyclone names
- ^ ESA - European Space Agency
- ^ http://www.abc.net.au/news/newsitems/200601/s1548322.htm[dead link]
- ^ Current Tropical Cyclones
- ^ http://www.grahamjacobs.com.au/mediareleases06/lakegracefloods.html[dead link]
- ^ a b c d Gary Padgett (25 April 2006). "Monthly Tropical Weather Summary for January 2006". Typhoon 2000. http://www.typhoon2000.ph/garyp_mgtcs/jan06sum.txt. Retrieved 28 December 2009.
- ^ a b "Cyclone 10P Best Track". Joint Typhoon Warning Center. 2007. http://www.usno.navy.mil/NOOC/nmfc-ph/RSS/jtwc/best_tracks/2006/2006s-bsh/bsh102006.txt. Retrieved 28 December 2009.
- ^ a b c Staff Writer (2006). "Significant Weather- January 2006". Australian Bureau of Meteorology. http://www.bom.gov.au/inside/services_policy/public/sigwxsum/sigw0106.shtml. Retrieved 28 December 2008.
- ^ a b c d e f "Australian Region Tropical Cyclone Best Tracks". Australian Bureau of Meteorology. 2009. http://www.bom.gov.au/cgi-bin/silo/cyclones.cgi. Retrieved 27 December 2009.
- ^ Staff Writer (23 February 2006). "Cyclone Kate south of Papua New Guinea capital". Radio New Zealand. http://www.rnzi.com/pages/news.php?op=read&id=22450. Retrieved 27 December 2009.
- ^ Staff Writer (24 February 2006). "Cyclone Kate intensifies off far-north Qld". ABC Australia. http://www.abc.net.au/news/newsitems/200602/s1577224.htm. Retrieved 27 December 2009.
- ^ Staff Writer (25 February 2006). "Surfers hurt by wild waves". Sunshine Coast Daily. http://www.sunshinecoastdaily.com.au/story/2006/02/25/scd-surfers-hurt-by-wild-waves/. Retrieved 27 December 2009.
- ^ a b c d Gary Padgett (2 May 2006). "Monthly Tropical Weather Summary for February 2006". Typhoon 2000. http://www.typhoon2000.ph/garyp_mgtcs/feb06sum.htm. Retrieved 27 December 2009.
- ^ Joint Typhoon Warning Center (2007). "Tropical Cyclone 15S Best Track". United States Navy. http://www.usno.navy.mil/NOOC/nmfc-ph/RSS/jtwc/best_tracks/2006/2006s-bsh/bsh152006.txt. Retrieved 26 December 2009.
- ^ Staff Writer (1 March 2006). "WA: Mop up begins after Cyclone Emma crosses Pilbara coast". AAP General News. http://www.highbeam.com/doc/1P1-119155721.html. Retrieved 26 December 2009.
- ^ Staff Writer (14 March 2006). "WA rivermouth closed after waters rise". ABC Australia. http://www.abc.net.au/news/australia/wa/geraldton/200603/s1591584.htm. Retrieved 26 December 2009.
- ^ Staff Writer (7 April 2006). "Fed Govt aid urged for flood affected farmers". ABC Australia. http://www.abc.net.au/news/stories/2006/04/07/1610658.htm. Retrieved 26 December 2009.
- ^ WebCite query result
- ^ Bureau of Meteorology (2006). "Significant Weather - March 2006" (PDF). Australian Government. http://www.bom.gov.au/inside/services_policy/public/sigwxsum/pdf/sigw0306.pdf. Retrieved 13 April 2008.
- ^ Fire and Emergency Services Authority (2007). "2005-06 Cyclones in Western Australia" (PDF). http://www.fesa.wa.gov.au/internet/upload/353351307/docs/cyclone4.pdf. Retrieved 15 April 2008.
- ^ Shire of Ashburton (19 June 2007). "Ordinary Council Meeting" (PDF). http://www.ashburton.wa.gov.au/publications/agendas_minutes/2007/minutes/file/at_download. Retrieved 10 June 2009.[dead link]
- ^ Bureau of Meteorology (2008). "Tropical Cyclone Names". Archived from the original on 2008-10-25. http://www.bom.gov.au/weather/cyclone/about/cyclone-names.shtml. Retrieved 15 April 2008.
- ^ http://weather.unisys.com/hurricane/archive/0603/06032700
- ^ a b c d Staff Writer (2006). "Severe Tropical Cyclone Monica". Australian Bureau of Meteorology. http://www.bom.gov.au/announcements/sevwx/nt/nttc20060417.shtml. Retrieved 22 December 2009.
- ^ a b Gary Padgett (18 August 2006). "Monthly Tropical Weather Summary for April 2006". Typhoon 2000. http://www.typhoon2000.ph/garyp_mgtcs/apr06sum.txt. Retrieved 28 December 2009.
- ^ a b "Cyclone 23S Best Track". Joint Typhoon Warning Center. 2007. http://www.usno.navy.mil/NOOC/nmfc-ph/RSS/jtwc/best_tracks/2006/2006s-bsh/bsh232006.txt. Retrieved 22 December 2009.
- ^ "Financial and Commonwealth reserves system summaries" (PDF). Government of Australia. 2007. http://www.environment.gov.au/parks/publications/annual/06-07/pubs/financial-summary.pdf. Retrieved 25 March 2009.
- ^ Kate Sieper (11 July 2006). "In the wake of Cyclone Monica". ABC News. http://www.abc.net.au/rural/content/2006/s1683500.htm. Retrieved 25 March 2009.
- ^ Kate Sieper (25 June 2006). "A 100-year wait to see the Arnhem forests again". ABC News. http://www.abc.net.au/rural/nt/content/2006/s1961143.htm. Retrieved 25 March 2009.
- ^ http://www.wmo.ch/web/www/TCP/OperationPlans/TCP24-English2004.pdf[dead link]
External links
- World Meteorological Organization
- Australian Bureau of Meteorology
- Joint Typhoon Warning Center (JTWC)
2000–09 Australian region cyclone seasons Categories:


Wikimedia Foundation. 2010.