- Mukinbudin, Western Australia
-
Mukinbudin
Western AustraliaPopulation: 281 (2006 Census)[1] Established: 1920s Postcode: 6479 Elevation: 314 m (1,030 ft) Location: LGA: Shire of Mukinbudin State District: Central Wheatbelt Federal Division: Durack Coordinates: 30°54′50″S 118°12′25″E / 30.914°S 118.207°E
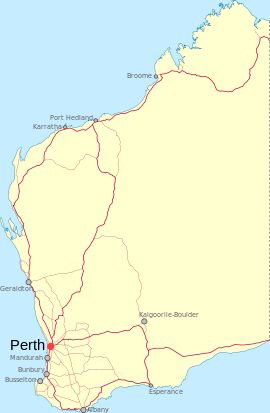
Mukinbudin is a town located in the North Eastern Wheatbelt region of Western Australia, approximately 293 kilometres (182 mi) east of Perth and 80 kilometres (50 mi) north of Merredin near Lake Campion. It is the main town in the Shire of Mukinbudin. At the 2006 census, Mukinbudin had a population of 281.[1]
The present Shire of Mukinbudin was settled by pastoralists who in the 1870s took up large leases in excess of 20,000 acres (81 km2) to run sheep and by sandalwood cutters and miners en route to the goldfields. In 1910 the first of the farmers arrived to commence wheat growing on their 1,000 acres (4 km2) block and it was some time before they added stock to what had been entirely a wheat growing enterprise. An extension of the Mount Marshall railway line to Mukinbudin and Lake Brown was approved in 1922 and opened in October 1923. The townsite was gazetted in 1922.
The town was hit by a wild storm in February 2011 and was lashed by strong winds with gusts over 125km/h[2] , large hailstone s and experienced some flooding. Dozens of power poles and hundreds of trees were blown over and parts of roads were washed away.[3]
Contents
Politics
Polling place statistics are shown below showing the votes from Mukinbudin in the federal and state elections as indicated.
2007 Federal Election
Source: AECLiberal 44.1% The Nationals 26.3% CDP 17.4% Labor 6.58% Family First 1.32% 2004 Federal Election
Source: AECLiberal 46.0% The Nationals 23.4% CDP 16.6% Labor 6.42% One Nation 4.53% 2001 Federal Election
Source: AECLiberal 60.7% One Nation 12.0% The Nationals 9.56% CDP 8.20% Labor 6.28% 2008 State Election
Source: WAECThe Nationals 66.8% CDP 18.4% Liberal 15.4% Labor 2.75% Greens 1.65% 2005 State Election
Source: WAECThe Nationals 60.9% CDP 20.7% Liberal 9.60% Labor 3.41% New Country 3.10% 2001 State Election
Source: WAECThe Nationals 56.7% One Nation 30.2% Labor 7.92% Independent 1.83% Independent 1.83% Notable past residents
- Mark Seaby - AFL Footballer
- Rowan Jones - AFL Footballer
- Todd Menegola - AFL Footballer
References
- ^ a b Australian Bureau of Statistics (25 October 2007). "Mukinbudin (L) (Urban Centre/Locality)". 2006 Census QuickStats. http://www.censusdata.abs.gov.au/ABSNavigation/prenav/LocationSearch?collection=Census&period=2006&areacode=UCL519400&producttype=QuickStats&breadcrumb=PL&action=401. Retrieved 18 July 2011.
- ^ "The West Australian - Mukinbudin hit by storm". 2011. http://au.news.yahoo.com/thewest/a/-/wa/8770271/mukinbudin-hit-by-storm/. Retrieved 2011-02-03.
- ^ "ABC News - Mukinbudin hit by wild storm". 2011. http://www.abc.net.au/news/stories/2011/02/03/3129010.htm. Retrieved 2011-02-03.
External links
Categories:- Towns in Western Australia
- Western Australia geography stubs
Wikimedia Foundation. 2010.

