- Nottingham East (UK Parliament constituency)
-
Nottingham East Borough constituency for the House of Commons 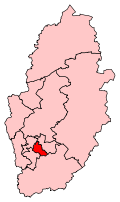
Boundary of Nottingham East in Nottinghamshire.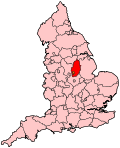
Location of Nottinghamshire within England.County Nottinghamshire Electorate 59,489 (December 2010)[1] Major settlements Nottingham Current constituency Created 1974 Member of Parliament Chris Leslie (Labour Co-op) Number of members One 1885–1955 Number of members One Type of constituency Borough constituency Created from Nottingham Overlaps European Parliament constituency East Midlands Nottingham East is a borough constituency represented in the House of Commons of the Parliament of the United Kingdom. It elects one Member of Parliament (MP) by the first past the post system of election.
Contents
Boundaries
The constituency covers the north-eastern part of the City of Nottingham. It includes the suburbs of Mapperley, Carrington and Sherwood, and the inner city areas of Hyson Green, St Ann's and Sneinton.
It is presently made up of the following electoral wards of the City of Nottingham: Arboretum; Berridge; Dales; Mapperley; St Ann's; and Sherwood.
From 1983 to 1997, the constituency was made up of the following electoral wards of the City of Nottingham: Basford; Forest; Greenwood; Manvers; Mapperley; Radford; St Ann's; Sherwood; and Trent. Michael Knowles and John Heppell were the MPs for the seat during this period. The City of Nottingham was not a unitary authority at this time.
History
The present Nottingham East constituency was created in 1974, and first elected Jack Dunnett who had been Labour MP for the abolished Nottingham Central seat. Michael Knowles won it for the Conservative Party in 1983. Knowles held the seat with a reduced majority in 1987, but John Heppell gained it for Labour in 1992, and held the seat until he retired in 2010. It is presently held by Labour's Chris Leslie. Although Leslie is a newcomer to this seat, he is no stranger to the House of Commons, as he previously represented the West Yorkshire constituency of Shipley from 1997 to 2005, and served as a junior minister in the Tony Blair Government.
MPs 1885–1955
Event Member [2] Party 1885 Arnold Morley Liberal 1895 Edward Bond Conservative 1906 Sir Henry John Stedman Cotton Liberal 1910 James Archibald Morrison Conservative 1912 by-election Sir John David Rees Conservative 1922 John Plowright Houfton Coalition Conservative 1923 Norman Birkett Liberal 1924 Clement Edmund Royds Brocklebank Conservative 1929 Norman Birkett Liberal 1931 Louis Halle Gluckstein Conservative 1945 James Harrison Labour 1955 constituency abolished MPs 1974–present
Event Member [2] Party Feb. 1974 Jack Dunnett Labour 1983 Michael Knowles Conservative 1992 John Heppell Labour 2010 Chris Leslie Labour Co-operative Elections
Elections in the 2010s
General Election 2010: Nottingham East[3] Party Candidate Votes % ±% Labour Co-op Chris Leslie 15,022 45.4 −1.3 Liberal Democrat Sam Boote 8,053 24.3 +2.5 Conservative Ewan Lamont 7,846 23.7 +1.2 UKIP Pat Wolfe 1,138 3.4 +0.9 Green Benjamin Hoare 928 2.8 −2.4 Christian Parvaiz Sardar 125 0.4 N/A Majority 6,969 21.0 −3.2 Turnout 33,112 56.4 +7.5 Labour Co-op hold Swing −1.3 Elections in the 2000s
General Election 2005: Nottingham East[4] Party Candidate Votes % ±% Labour John Heppell 13,787 45.8 −13.2 Liberal Democrat Issan Ghazni 6,848 22.8 +9.8 Conservative Jim Thornton 6,826 22.7 −1.6 Green Ashley Baxter 1,517 5.0 N/A UKIP Anthony Ellwood 740 2.5 N/A Socialist Unity Pete Radcliff 373 1.2 N/A Majority 6,939 23.1 Turnout 30,091 49.6 +4.1 Labour hold Swing −11.5 General Election 2001: Nottingham East[5] Party Candidate Votes % ±% Labour John Heppell 17,530 59.0 -3.3 Conservative Richard Allan 7,210 24.3 +0.8 Liberal Democrat Tim Ball 3,874 13.0 +2.9 Socialist Alliance Pete Radcliff 1,117 3.8 N/A Majority 10,320 34.7 Turnout 29,731 45.5 -15.0 Labour hold Swing −2.0 Elections in the 1990s
General Election 1997: Nottingham East[6] Party Candidate Votes % ±% Labour John Heppell 24,755 62.3 Conservative Andrew Raca 9,336 23.5 Liberal Democrat Kevin Mulloy 4,008 10.1 Referendum Party Ben Brown 1,645 4.1 Majority 15,419 38.8 Turnout 39,744 60.5 Labour hold Swing General Election 1992: Nottingham East[7] Party Candidate Votes % ±% Labour John Heppell 25,026 52.6 +10.6 Conservative Michael Knowles 17,346 36.4 −6.5 Liberal Democrat Tim S. Ball 3,695 7.8 −6.9 Green Andrew G. Jones 667 1.4 +1.4 Liberal Charles W. Roylance 598 1.3 −13.4 Natural Law John Ashforth 283 0.6 +0.6 Majority 7,680 16.1 +15.2 Turnout 47,615 70.1 +1.3 Labour gain from Conservative Swing +8.6 "
Elections in the 1920s
General Election 1929: Nottingham East Party Candidate Votes % ±% Liberal Norman Birkett 14,049 40.2 -1.4 Conservative Louis Gluckstein 11,110 31.8 -15.8 Labour J H Baum 9,787 28.0 +28.0 Majority 2,939 8.4 Turnout 34,946 78.9 +4.2 Liberal gain from Conservative Swing +7.2 General Election 1923: Nottingham East Party Candidate Votes % ±% Liberal Norman Birkett 11,355 53.4 +6.3 Conservative John Houfton 9,919 46.6 -13.1 Majority 1,436 6.8 Turnout 21,274 67.8 +1.6 Liberal gain from Conservative Swing +26.2 Elections in the 1900s
1906 General Election: Nottingham East Party Candidate Votes % ±% Liberal Henry Cotton 6,020 58.4 +12.7 Conservative Edward Bond 4,290 41.6 -12.7 Majority 1,730 16.8 Liberal gain from Conservative Swing 12.7 Turnout 10,310 82.8 +7.9 See also
Notes and references
- ^ "Electorate Figures - Boundary Commission for England". 2011 Electorate Figures. Boundary Commission for England. 4 March 2011. http://www.boundarycommissionforengland.org.uk/electoral-figures/electoral-figures.htm. Retrieved 13 March 2011.
- ^ a b Leigh Rayment's Historical List of MPs – Constituencies beginning with "N" (part 3)
- ^ "Election 2010 - Nottingham East". BBC News. http://news.bbc.co.uk/1/shared/election2010/results/constituency/d39.stm. Retrieved 30 September 2010.
- ^ "Election 2005 - Nottingham East". BBC News. 23 May 2005. http://news.bbc.co.uk/1/shared/vote2005/html/438.stm. Retrieved 30 September 2010.
- ^ "Vote 2001 - Nottingham East". BBC News. http://news.bbc.co.uk/hi/english/static/vote2001/results_constituencies/constituencies/438.stm. Retrieved 30 September 2010.
- ^ "Vote 2001 - Nottingham East". BBC News. http://news.bbc.co.uk/hi/english/static/vote2001/results_constituencies/constituencies/438.stm. Retrieved 30 September 2010.
- ^ "Politics Resources". Election 1992. Politics Resources. 9 April 1992. http://www.politicsresources.net/area/uk/ge92/i15.htm. Retrieved 2010-12-06.
Constituencies in the East Midlands (46) Conservative (31) Amber Valley · Boston and Skegness · Bosworth · Broxtowe · Charnwood · Corby · Daventry · Derbyshire Dales · Erewash · Gainsborough · Grantham and Stamford · Harborough · High Peak · Kettering · Lincoln · Loughborough · Louth and Horncastle · Mid Derbyshire · Newark · Northampton North · Northampton South · North West Leicestershire · Rushcliffe · Rutland and Melton · Sherwood · Sleaford and North Hykeham · South Derbyshire · South Holland and The Deepings · South Leicestershire · South Northamptonshire · Wellingborough
Labour (15) Ashfield · Bassetlaw · Bolsover · Chesterfield · Derby North · Derby South · Gedling · Leicester East · Leicester South · Leicester West · Mansfield · North East Derbyshire · Nottingham East · Nottingham North · Nottingham South
East Midlands European constituency: Conservative (2) · Labour (1) · UKIP (1) · Liberal Democrats (1)Categories:- Politics of Nottingham
- Parliamentary constituencies in Nottinghamshire
- United Kingdom Parliamentary constituencies established in 1885
- United Kingdom Parliamentary constituencies disestablished in 1955
- United Kingdom Parliamentary constituencies established in 1974


Wikimedia Foundation. 2010.