- Daventry (UK Parliament constituency)
-
Daventry County constituency for the House of Commons 
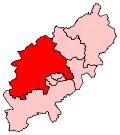
Boundary of Daventry in Northamptonshire.
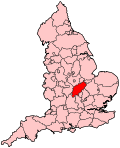
Location of Northamptonshire within England.County Northamptonshire Electorate 71,903 (December 2010)[1] Current constituency Created 1974 Member of Parliament Chris Heaton-Harris (Conservative) Number of members One Created from South Northamptonshire 1918–1950 Replaced by South Northamptonshire Created from South Northamptonshire Overlaps European Parliament constituency East Midlands Daventry is a county constituency represented in the House of Commons of the Parliament of the United Kingdom. It is a strongly Conservative seat.
Contents
Boundaries
The constituency covers the west of Northamptonshire and is named for the market town of Daventry. It covers the western part of Daventry and South Northamptonshire local government districts.
Boundary review
Following a review of parliamentary representation in Northamptonshire, the Boundary Commission for England has created a new seat in the county, meaning consequential changes to the existing seats.
A modified Daventry constituency is formed from the following electoral wards;
- The district of Daventry
- Two wards from the Wellingborough borough - Earls Barton and West (covering the villages of Sywell and Mears Ashby)
- The South Northamptonshire wards of Harpole and Grange (covering the villages of Milton Malsor, Kislingbury, Gayton, Harpole and Rothersthorpe), and Heyfords and Bugbrooke (covering the villages of Bugbrooke, Nether Heyford and Upper Heyford)
Members of Parliament
MPs 1918–1950
Election Member[2] Party 1918 Edward FitzRoy Conservative then Speaker 1943 by-election Reginald Manningham-Buller Conservative 1950 constituency abolished MPs since Feb 1974
Election Member[2] Party Feb 1974 Arthur Jones Conservative 1979 Reg Prentice Conservative 1987 Tim Boswell Conservative 2010 Chris Heaton-Harris Conservative Elections
Elections in the 2010s
General Election 2010: Daventry [3][4][5] Party Candidate Votes % ±% Conservative Chris Heaton-Harris 29,252 56.5 +3.5 Liberal Democrat Christopher McGlynn[6] 10,064 19.4 +4.9 Labour Paul Corazzo 8,168 15.8 -12.1 UKIP Jim Broomfield 2,333 4.5 +1.6 English Democrats Alan Bennett-Spencer 1,187 2.3 +2.3 Green Steve Whiffen 770 1.5 +1.5 Majority 19,188 37.1 Turnout 51,774 72.5 +4.6 Conservative hold Swing -0.7 After the 2005 general election, Daventry incurred massive boundary changes following the creation of the new South Northamptonshire seat. The results of the 2010 general election are based on the notional results for the new boundaries.
Elections in the 2000s
General Election 2005: Daventry Party Candidate Votes % ±% Conservative Tim Boswell 31,206 51.6 +2.4 Labour Andrew Hammond 16,520 27.3 -4.9 Liberal Democrat Hannah Saul 9,964 16.5 +0.4 UKIP Barry Mahoney 1,927 3.2 +0.8 Veritas Barrie Wilkins 822 1.4 +1.4 Majority 14,686 24.3 Turnout 60,439 68.1 +2.6 Conservative hold Swing +3.6 General Election 2001: Daventry Party Candidate Votes % ±% Conservative Tim Boswell 27,911 49.2 +2.9 Labour Kevin Quigley 18,262 32.2 -2.2 Liberal Democrat Jamie Calder 9,130 16.1 +1.2 UKIP Peter Baden 1,381 2.4 +1.7 Majority 9,649 17.0 Turnout 56,684 65.5 -10.9 Conservative hold Swing +2.6 Elections in the 1990s
General Election 1997: Daventry Party Candidate Votes % ±% Conservative Tim Boswell 28,615 46.3 -12.1 Labour K, Richie 21,237 34.4 +10.1 Liberal Democrat J. Gordon 9,233 15.0 -1.6 Referendum Party Mrs. B. Russocki 2,018 3.3 N/A UKIP B. Mahoney 443 0.7 N/A Natural Law R. France 204 0.3 -0.4 Majority 7,378 11.9 Turnout 61,750 77.0 Conservative hold Swing -11.1 General Election 1992: Daventry[7] Party Candidate Votes % ±% Conservative Tim Boswell 34,734 58.4 +0.5 Labour Mrs LMAW Koumi 14,460 24.3 +3.8 Liberal Democrat AS Rounthwaite 9,820 16.5 −5.0 Natural Law RB France 422 0.7 N/A Majority 20,274 34.1 −2.3 Turnout 59,436 82.7 +4.6 Conservative hold Swing −1.7 Notes and references
- ^ "Electorate Figures - Boundary Commission for England". 2011 Electorate Figures. Boundary Commission for England. 4 March 2011. http://www.boundarycommissionforengland.org.uk/electoral-figures/electoral-figures.htm. Retrieved 13 March 2011.
- ^ a b Leigh Rayment's Historical List of MPs – Constituencies beginning with "D" (part 1)
- ^ Statement of Persons Nominated, Daventry District Council
- ^ Daventry, UKPollingReport
- ^ Daventry, BBC
- ^ Northampton Chronicle & Echo 21 April 2010
- ^ "Politics Resources". Election 1992. Politics Resources. 9 April 1992. http://www.politicsresources.net/area/uk/ge92/ge92index.htm. Retrieved 2010-12-06.
See also
Parliament of the United Kingdom Preceded by
HalifaxConstituency represented by the Speaker
1928–1943Succeeded by
HexhamCoordinates: 52°18′N 1°05′W / 52.30°N 1.08°W
Constituencies in the East Midlands (46) Conservative (31) Amber Valley · Boston and Skegness · Bosworth · Broxtowe · Charnwood · Corby · Daventry · Derbyshire Dales · Erewash · Gainsborough · Grantham and Stamford · Harborough · High Peak · Kettering · Lincoln · Loughborough · Louth and Horncastle · Mid Derbyshire · Newark · Northampton North · Northampton South · North West Leicestershire · Rushcliffe · Rutland and Melton · Sherwood · Sleaford and North Hykeham · South Derbyshire · South Holland and The Deepings · South Leicestershire · South Northamptonshire · Wellingborough
Labour (15) East Midlands European constituency: Conservative (2) · Labour (1) · UKIP (1) · Liberal Democrats (1) Categories:- Parliamentary constituencies in Northamptonshire
- United Kingdom Parliamentary constituencies disestablished in 1950
- United Kingdom Parliamentary constituencies established in 1918
- United Kingdom Parliamentary constituencies established in 1974
- United Kingdom constituency stubs
Wikimedia Foundation. 2010.
