- Corby (UK Parliament constituency)
-
Corby County constituency for the House of Commons 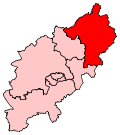
Boundary of Corby in Northamptonshire.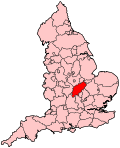
Location of Northamptonshire within England.County Northamptonshire Electorate 79,468 (December 2010)[1] Current constituency Created 1983 Member of Parliament Louise Mensch (Conservative) Created from Kettering and Wellingborough Overlaps European Parliament constituency East Midlands Corby is a county constituency represented in the House of Commons of the Parliament of the United Kingdom. It elects one Member of Parliament (MP) by the first-past-the-post voting system, and is currently a marginal seat between Labour and the Conservatives.
Contents
Boundaries
The constituency was created in 1983 from parts of the seats of Kettering and Wellingborough. It is named after the town of Corby in Northamptonshire, and also covers most of the local government district of East Northamptonshire. The seat is a highly marginal contest between the Tories and Labour. Corby itself is the most Labour-voting area; many speak with a Scottish accent after the migration of workers in the 1930s from north of the border to the town's former steelworks; the rest of the constituency, consisting of a number of smaller towns including Irthlingborough, Thrapston, Raunds, Oundle and the rural villages, is mostly Conservative.
Boundary review
Following their review of parliamentary representation in Northamptonshire, the Boundary Commission for England has created a new seat in the county, meaning consequential changes to the existing constituencies.
The electoral wards used to create the modified constituency are;
- The borough of Corby
- The East Northamptonshire wards of Barnwell, Dryden, Fineshade, Irthlingborough, King’s Forest, Lower Nene, Lyveden, Oundle, Prebendal, Raunds Saxon, Raunds Windmill, Ringstead, Stanwick, Thrapston and Woodford.
Members of Parliament
Election Member [2] Party 1983 William Powell Conservative 1997 Phil Hope Labour Co-operative 2010 Louise Mensch[3] Conservative Elections
Elections in the 2010s
General Election 2010: Corby[4][5] Party Candidate Votes % ±% Conservative Louise Mensch (then Bagshawe) 22,886 42.2 +2.3 Labour Phil Hope 20,935 38.6 -4.5 Liberal Democrat Portia Wilson 7,834 14.5 +1.7 BNP Roy Davies 2,525 4.7 N/A Majority 1,951 3.6 Turnout 54,180 69.2 +3.6 Conservative gain from Labour Swing 3.4 Elections in the 2000s
General Election 2005: Corby Party Candidate Votes % ±% Labour Co-op Phil Hope 20,913 43.1 -6.2 Conservative Andrew Griffith 19,396 40.0 +2.7 Liberal Democrat David Radcliffe 6,184 12.7 +2.7 UKIP Ian Gillman 1,278 2.6 +0.8 Socialist Labour Steven Carey 499 1.0 -0.6 Independent John Morris 257 0.5 Majority 1,517 3.1 Turnout 47,727 65.6 +0.6 Labour Co-op hold Swing 4.5 General Election 2001: Corby Party Candidate Votes % ±% Labour Co-op Phil Hope 23,283 49.3 -6.1 Conservative Andrew Griffith 17,583 37.2 +3.8 Liberal Democrat Kevin Scudder 4,751 10.1 +2.6 UKIP Ian Gillman 855 1.8 +0.9 Socialist Labour Andrew Dickson 750 1.6 N/A Majority 5,700 12.1 Turnout 47,222 65.0 -12.6 Labour Co-op hold Swing 5.0 Elections in the 1990s
General Election 1997: Corby Party Candidate Votes % ±% Labour Co-op Phil Hope 29,888 55.4 +11.5 Conservative William Powell 18,028 33.4 -11.1 Liberal Democrat Ian Hankison 4,045 7.5 -2.7 Referendum Party Sebastian Riley-Smith 1,356 2.5 N/A UKIP Ian Gillman 507 0.9 N/A Natural Law Jane Bence 133 0.2 N/A Majority 11,860 22.0 Turnout 53,957 77.9 -5.0 Labour Co-op gain from Conservative Swing -11.3 General Election 1992: Corby[6] Party Candidate Votes % ±% Conservative William Rhys Powell 25,203 44.5 +0.2 Labour Harry Feather 24,861 43.9 +3.0 Liberal Democrat Melvyn Roffe 5,792 10.2 -4.6 Liberal J.I. Wood 784 1.4 N/A Majority 342 0.6 -2.8 Turnout 56,640 82.9 +3.3 Conservative hold Swing -1.4 Elections in the 1980s
General Election 1987: Corby Party Candidate Votes % ±% Conservative William Rhys Powell 23,323 44.3 +1.7 Labour Harry Feather 21,518 40.9 +4.8 Liberal T.G. Whittington 7,805 14.8 -5.5 Majority 1,805 3.4 -3.1 Turnout 52,646 79.6 +2.1 Conservative hold Swing -1.5 General Election 1983: Corby Party Candidate Votes % ±% Conservative William Rhys Powell 20,827 42.6 Labour William Homewood 17,659 36.1 Liberal T.G. Whittington 9,905 20.3 Ecology R.J. Stanning 505 1.0 Majority 3,168 6.5 Turnout 48,896 77.5 Conservative win (new seat) See also
- List of Parliamentary constituencies in Northamptonshire
- Corby Borough Council elections 2003
- East Northamptonshire District Council Elections 2003
- Northamptonshire County Council Elections 2005
Notes and references
- ^ "Electorate Figures - Boundary Commission for England". 2011 Electorate Figures. Boundary Commission for England. 4 March 2011. http://www.boundarycommissionforengland.org.uk/electoral-figures/electoral-figures.htm. Retrieved 13 March 2011.
- ^ Leigh Rayment's Historical List of MPs – Constituencies beginning with "C" (part 5)
- ^ Known at the time of her election as Louise Bagshawe.
- ^ Statement of Persons Nominated, Corby Borough Council
- ^ Corby UKPolling
- ^ "Politics Resources". Election 1992. Politics Resources. 9 April 1992. http://www.politicsresources.net/area/uk/ge92/ge92index.htm. Retrieved 6 Dec 2010.
Constituencies in the East Midlands (46) Conservative (31) Amber Valley · Boston and Skegness · Bosworth · Broxtowe · Charnwood · Corby · Daventry · Derbyshire Dales · Erewash · Gainsborough · Grantham and Stamford · Harborough · High Peak · Kettering · Lincoln · Loughborough · Louth and Horncastle · Mid Derbyshire · Newark · Northampton North · Northampton South · North West Leicestershire · Rushcliffe · Rutland and Melton · Sherwood · Sleaford and North Hykeham · South Derbyshire · South Holland and The Deepings · South Leicestershire · South Northamptonshire · Wellingborough
Labour (15) East Midlands European constituency: Conservative (2) · Labour (1) · UKIP (1) · Liberal Democrats (1) Categories:- Parliamentary constituencies in Northamptonshire
- United Kingdom Parliamentary constituencies established in 1983
- Corby
- East Northamptonshire


Wikimedia Foundation. 2010.