- Chesterfield (UK Parliament constituency)
-
Chesterfield Borough constituency for the House of Commons 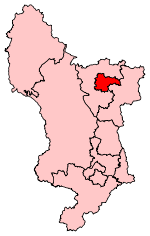
Boundary of Chesterfield in Derbyshire for the 2010 general election.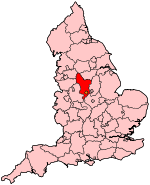
Location of Derbyshire within England.County Derbyshire Electorate 72,866 (December 2010)[1] Major settlements Chesterfield Current constituency Created 1885 Member of Parliament Toby Perkins (Labour) Number of members One Created from Derbyshire East Overlaps European Parliament constituency East Midlands Chesterfield is a constituency represented in the House of Commons of the Parliament of the United Kingdom. It is a marginal seat between Labour and the Liberal Democrats. The best-known MP was Tony Benn from 1984 to 2001. The current MP is Toby Perkins of the Labour Party, first elected at the 2010 general election.
Contents
Boundaries
It includes most of the town of Chesterfield, including the Church of St Mary and All Saints with its famous 'crooked spire', and borders the constituencies of Bolsover and Derbyshire North East.
The current boundaries centre on Chesterfield itself, with the areas around Staveley, and Barrow Hill, falling within the neighbouring North East Derbyshire seat. Under the boundary changes necessary to accommodate the new Mid Derbyshire constituency, Chesterfield is only moderately effected, losing New Whittington to North East Derbyshire but otherwise keeping its shape.
History
Chesterfield was once a Labour Party stronghold. The former Labour cabinet minister Tony Benn held the seat from a by-election in 1984 until his retirement at the 2001 general election (to "spend more time involved in politics"). Paul Holmes gained the seat for the Liberal Democrats at the 2001 general election, the party's first seat in the East Midlands in the House of Commons, but narrowly lost the seat in 2010 to the Labour candidate Toby Perkins; one of only three seats the Labour Party gained in the 2010 election.
Members of Parliament
Year Member[2] Party 1885 Alfred Barnes Liberal 1886 Liberal Unionist 1892 Thomas Bayley Liberal 1906 James Haslam Lib-Lab 1910 Labour 1913 Barnet Kenyon Lib-Lab 1918 Liberal 1929 George Benson Labour 1931 Roger Conant Conservative 1935 George Benson Labour 1964 Eric Varley Labour 1984 Tony Benn Labour 2001 Paul Holmes Liberal Democrat 2010 Toby Perkins Labour Election Results
Election Political result Candidate Party Votes % ±% General Election 2010
Electorate: 72,866
Turnout: 45,839 (63.8%) +3.8Labour gain from Liberal Democrat
Majority: 549 (1.2%) N/A
Swing: 3.8% from LibDem to LabToby Perkins Labour 17,891 39.0 -1.6 Paul Holmes Liberal Democrat 17,342 37.8 -9.1 Carolyn Abbott Conservative 7,214 15.7 +7.5 David Phillips UKIP 1,432 3.1 +0.9 Ian Jerram English Democrats 1,213 2.6 +0.8 Duncan Kerr Green 600 1.3 N/A John "Noneoftheabove" Daramy Independent 147 0.3 N/A General Election 2005
Turnout: 44,121 (59.6%) -1.1Liberal Democrat
Majority: 3,045 (6.9%) +1.1
Swing: +0.6% from Lab to LibDemPaul Holmes Liberal Democrat 20,875 47.3 -0.5 Simon Rich Labour 17,830 40.4 -1.6 Mark Kreling Conservative 3,605 8.2 +0.1 Christopher Brady UKIP 997 2.3 N/A Ian Jerram English Democrats 814 1.8 N/A General Election 2001
Turnout: 44,441 (60.7%) -10.2Liberal Democrat gain from Labour
Majority: 2,586 (5.8%) N/A
Swing: 8.6% from Lab to LibDemPaul Holmes Liberal Democrat 21,249 47.8 +8.3 Reg Race Labour 18,663 42.0 -8.8 Simon Hitchcock Conservative 3,613 8.1 -1.1 Jeannie Robinson Socialist Alliance 437 1.0 N/A Bill Harrison Socialist Labour 295 0.7 N/A' Christopher Rawson Independent 184 0.4 N/A General Election 1997
Turnout: 51,389 (78.0%)Labour hold
Majority: 5,775 N/ATony Benn Labour 26,105 50.8 +3.5 Tony Rogers Liberal Democrat 20,330 39.6 +3.8 Martin Potter Conservative 4,752 9.2 -7.7 Norman Scarth Independent 202 0.4 N/A General Election 1992
Turnout: 55,981 (78.1%) +1.4Labour hold
Majority: 6,414 (11.5%) -4.4Tony Benn Labour 26,461 47.3 +1.8 AH Rogers Liberal Democrat 20,047 35.8 +6.2 PG Lewis Conservative 9,473 16.9 -8.0 General Election 1987
Turnout: 53,959 (76.7%) -0.2Labour hold
Majority: 8,577 (15.9%) +4.1Tony Benn Labour 24,532 44.9 -1.6 Tony Rogers Liberal 15,955 29.6 -5.1 RP Grant Conservative 13,472 25.0 +9.8 Chesterfield by-election, 1984
Turnout: 52,992 (76.9%) +4.3Labour hold
Majority: 6,264 (11.8%) -3.8Tony Benn Labour 24,633 46.5 -1.6 Max Payne Liberal 18,369 34.7 +15.1 Nick Bourne Conservative 8,028 15.2 -17.3 Bill Maynard Independent 1,355 2.6 N/A Screaming Lord Sutch Monster Raving Loony 178 0.3 N/A David Bentley Independent 116 0.2 N/A John Davey Independent 83 0.3 N/A Thomas Layton Independent 46 0.1 N/A Helen Anscombe Independent 34 0.1 N/A Jitendra Bardwaj Independent 33 0.1 N/A Donald Butler Independent 24 0.1 N/A Paul Nicholls-Jones Independent 22 0.0 N/A Sid Shaw Independent 20 0.1 N/A Christopher Hill Independent 17 0.0 N/A Giancarlo Piccaro Independent 15 0.0 N/A David Cahill Independent 12 0.0 N/A John Connell Independent 7 0.0 N/A General Election 1983
Turnout: 49,704 (72.6%) -0.8Labour hold
Majority: 7,763 (15.6%) -9.5Eric Varley Labour 23,881 48.1 -9.3 Nick Bourne Conservative 16,118 32.4 +0.2 Max Payne Liberal 9,705 19.5 +9.1 Elections in the 1970s
General Election 1979: Chesterfield Party Candidate Votes % ±% Labour Eric Varley 31,049 57.4 Conservative S. Hill 17,445 32.2 Liberal M. Payne 5,617 10.4 Majority 13,604 25.1 Turnout 73.4 Labour hold Swing General Election October 1974: Chesterfield Party Candidate Votes % ±% Labour Eric Varley 30,953 59.9 Conservative J. D. Taylor 13,393 25.9 Liberal M. W. Brown 7,349 14.2 Majority 17,560 34.0 Turnout 72.6 Labour hold Swing General Election February 1974: Chesterfield Party Candidate Votes % ±% Labour Eric Varley 31,040 54.8 Conservative J. D. Taylor 15,644 27.6 Liberal M. W. Brown 9,937 17.6 Majority 15,396 27.2 Turnout 80.1 Labour hold Swing General Election 1970: Chesterfield Party Candidate Votes % ±% Labour Eric Varley 30,386 59.0 Conservative J. C. Ramsden 16,217 31.5 Liberal T. D. Bamford 4,891 9.5 Majority 14,169 27.5 Turnout 72.4 Labour hold Swing Elections in the 1960s
General Election 1966: Chesterfield Party Candidate Votes % ±% Labour Eric Varley 31,542 61.6 Conservative A. T. Hale 13,443 26.3 Liberal T. D. Bamford 6,227 12.2 Majority 18,099 35.3 Turnout 76.7 Labour hold Swing General Election 1964: Chesterfield Party Candidate Votes % ±% Labour Eric Varley 29,452 56.5 Conservative W. G. Blake 14,944 28.7 Liberal D. A. McKie 7,738 14.8 Majority 14,508 27.8 Turnout 78.8 Labour hold Swing Elections in the 1950s
General Election 1959: Chesterfield Party Candidate Votes % ±% Labour George Benson 30,534 56.6 Conservative J. A. Lemkin 17,084 31.7 Liberal G. R. Smedley-Stevenson 6,360 11.8 Majority 13,450 24.9 Turnout 82.7 Labour hold Swing General Election 1955: Chesterfield Party Candidate Votes % ±% Labour George Benson 29,602 57.7 Liberal National F. Hadfield 21,748 42.4 Majority 7,854 15.3 Turnout 79.9 Labour hold Swing General Election 1951: Chesterfield Party Candidate Votes % ±% Labour George Benson 34,753 63.7 Liberal National J. F. Nash 19,776 36.3 Majority 14,977 27.5 Turnout 84.2 Labour hold Swing General Election 1950: Chesterfield Party Candidate Votes % ±% Labour George Benson 33,914 60.8 Liberal National Andrew Cavendish 17,231 30.9 Liberal J. O'Neill 4,052 7.3 Communist B. Barker 554 1.0 Majority 16,683 29.9 Turnout 87.0 Labour hold Swing Elections in the 1940s
General Election 1945: Chesterfield Party Candidate Votes % ±% Labour George Benson 29,459 62.8 Liberal National Marquess of Hartington 17,424 37.2 Majority 12,035 25.7 Turnout 46,883 77.4 Labour hold Swing See also
Notes and references
- ^ "Electorate Figures - Boundary Commission for England". 2011 Electorate Figures. Boundary Commission for England. 4 March 2011. http://www.boundarycommissionforengland.org.uk/electoral-figures/electoral-figures.htm. Retrieved 13 March 2011.
- ^ Leigh Rayment's Historical List of MPs – Constituencies beginning with "C" (part 3)
Sources
- Guardian Unlimited Politics (Election results from 1992 to the present)
- http://www.psr.keele.ac.uk/ (Election results from 1951 to the present)
Constituencies in the East Midlands (46) Conservative (31) Amber Valley · Boston and Skegness · Bosworth · Broxtowe · Charnwood · Corby · Daventry · Derbyshire Dales · Erewash · Gainsborough · Grantham and Stamford · Harborough · High Peak · Kettering · Lincoln · Loughborough · Louth and Horncastle · Mid Derbyshire · Newark · Northampton North · Northampton South · North West Leicestershire · Rushcliffe · Rutland and Melton · Sherwood · Sleaford and North Hykeham · South Derbyshire · South Holland and The Deepings · South Leicestershire · South Northamptonshire · Wellingborough
Labour (15) Ashfield · Bassetlaw · Bolsover · Chesterfield · Derby North · Derby South · Gedling · Leicester East · Leicester South · Leicester West · Mansfield · North East Derbyshire · Nottingham East · Nottingham North · Nottingham South
East Midlands European constituency: Conservative (2) · Labour (1) · UKIP (1) · Liberal Democrats (1) Categories:- Parliamentary constituencies in Derbyshire
- United Kingdom Parliamentary constituencies established in 1885
- Chesterfield


Wikimedia Foundation. 2010.