- Nottingham North (UK Parliament constituency)
-
Nottingham North
Borough constituency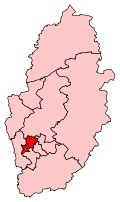
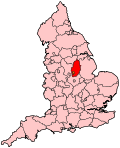
Nottingham North shown within Nottinghamshire, and Nottinghamshire shown within England Created: 1955 Electorate: 64,578 (December 2010) MP: Graham Allen Party: Labour Type: House of Commons County: Nottinghamshire EP constituency: East Midlands Nottingham North is a borough constituency represented in the House of Commons of the Parliament of the United Kingdom. It elects one Member of Parliament (MP) by the first past the post system of election. The current MP is Graham Allen of the Labour Party, first elected at the 1987 general election.
Contents
Boundaries
The constituency covers the north-western part of the City of Nottingham.
Constituency profile
The constituency consists mostly of large council estates and residential areas such as Bulwell. It is the most working-class of the three Nottingham constituencies, and thus unsurprisingly the safest for the Labour Party.
Unemployment
The decline of coalmining and the textile industry in the area during the final three decades of the 20th century has brought mass unemployment to Nottingham North, with up to 12.8% of its residents being registered unemployed in 2009.[1]
History
The constituency was created in 1955, and elected Labour MPs until Richard Ottaway surprisingly gained it for the Conservative Party in their landslide victory of 1983. Graham Allen regained the seat for Labour in 1987, and has held it since.
Members of Parliament
Election Member[2] Party Notes 1955 James Harrison Labour Died in office May 1959; seat remained vacant until general election in October 1959 Bill Whitlock Labour 1983 Richard Ottaway Conservative Has been MP for Croydon South since 1992. 1987 Graham Allen Labour Present incumbent Elections
Elections in the 2010s
General Election 2010: Nottingham North[3] Party Candidate Votes % ±% Labour Graham Allen 16,648 48.6 -10.6 Conservative Martin Curtis 8,508 24.8 +6.7 Liberal Democrat Tim Ball 5,849 17.1 -0.3 BNP Simon Brindley 1,944 5.7 +5.7 UKIP Irenea Marriot 1,338 3.9 -1.5 Majority 8,138 23.7 Turnout 34,285 54.2 +5.8 Labour hold Swing −8.7 Elections in the 2000s
General Election 2005: Nottingham North[4] Party Candidate Votes % ±% Labour Graham Allen 17,842 58.7 −5.8 Conservative Priti Patel 5,671 18.7 −5.1 Liberal Democrat Tim Ball 5,190 17.1 +6.5 UKIP Irena Marriott 1,680 5.5 N/A Majority 12,171 40.1 Turnout 30,383 49.1 +2.4 Labour hold Swing −0.3 General Election 2001: Nottingham North[5] Party Candidate Votes % ±% Labour Graham Allen 19,392 64.5 -1.2 Conservative Martin Wright 7,152 23.8 +3.5 Liberal Democrat Rob Lee 3,177 10.6 +2.6 Socialist Labour Andrew Botham 321 1.1 N/A Majority 12,240 40.7 Turnout 30,042 46.7 -16.3 Labour hold Swing −2.3 Elections in the 1990s
General Election 1997: Nottingham North[5] Party Candidate Votes % ±% Labour Graham Allen 27,203 65.71 Conservative G Shaw 8,402 20.29 Liberal Democrat R Oliver 3,301 7.97 Referendum Party J Neal 1,858 4.49 Socialist Alternative A Belfield 637 1.54 Majority 18,801 45.41 Turnout 41,401 62.98 Labour hold Swing General Election 1992: Nottingham North[6] Party Candidate Votes % ±% Labour Graham Allen 29,052 55.7 +10.8 Conservative Ian G. Bridge 18,309 35.1 −6.5 Liberal Democrat Anthony Skelton 4,477 8.6 −3.1 Natural Law Alwyn C. Cadman 274 0.5 N/A Majority 10,743 20.6 +17.3 Turnout 52,112 75.0 +2.4 Labour hold Swing +8.7 Elections in the 1980s
General Election 1987: Nottingham North Party Candidate Votes % ±% Labour Graham Allen 22,713 44.93 Conservative R G J Ottaway 21,048 41.64 SDP–Liberal Alliance S C Fernando 5,912 11.69 Communist John H Peck 879 1.74 Majority 1,665 3.29 Turnout 69,620 72.61 Labour gain from Conservative Swing General Election 1983: Nottingham North Party Candidate Votes % ±% Conservative R G J Ottaway 18,730 39.45 Labour W C Whitlock 18,368 38.68 SDP–Liberal Alliance L Williams 9,200 19.38 Communist John H Peck 1,184 2.49 Majority 362 0.76 Turnout 71,807 66.12 Conservative gain from Labour Swing Elections in the 1970s
General Election 1979: Nottingham North Party Candidate Votes % ±% Labour W C Whitlock 25,028 46.86 Conservative P Waine 21,956 41.11 Liberal J Stockley 4,900 9.17 Communist John H Peck 1,071 2.01 National Front R Pratt 454 0.85 Majority 3,072 5.75 Turnout 78,996 67.61 Labour hold Swing General Election October 1974: Nottingham North (new boundaries) Party Candidate Votes % ±% Labour W C Whitlock 24,694 48.10 Conservative M F Spungin 17,853 34.78 Liberal M Crew-Gee 7,470 14.55 National Front D Caine 792 1.54 Communist John H Peck 525 1.02 Majority 6,841 13.33 Turnout 76,490 67.11 Labour hold Swing (Boundary changes for 1974)
General Election February 1974: Nottingham North Party Candidate Votes % ±% Labour W C Whitlock 25,435 44.78 Conservative M F Spungin 20,990 36.95 Liberal P Edwards 9,623 16.94 Communist John H Peck 754 1.33 Majority 4,445 7.83 Turnout 75,866 74.87 General Election 1970: Nottingham North Party Candidate Votes % ±% Labour W C Whitlock 25,898 52.83 Conservative W Derbyshire 18,616 37.98 Liberal M V Edwards 3,763 7.68 Communist John H Peck 741 1.51 Majority 7,282 14.86 Turnout 70,672 69.36 Labour hold Swing Elections in the 1960s
General Election 1966: Nottingham North Party Candidate Votes % ±% Labour William Charles Whitlock 30,260 60.62 Conservative J N L Tillett 18,590 37.24 Communist John H Peck 1,070 2.14 Majority 11,670 23.38 Turnout 67,321 74.15 Labour hold Swing General Election 1964: Nottingham North Party Candidate Votes % ±% Labour William Charles Whitlock 29,535 57.14 Conservative Peter Derek Fry 20,578 39.81 Communist John H Peck 1,579 3.05 Majority 8,957 17.33 Turnout 66,477 77.76 Labour hold Swing Elections in the 1950s
General Election 1959: Nottingham North Party Candidate Votes % ±% Labour W C Whitlock 24,005 47.19 Conservative A G Blake 18,952 37.26 Liberal S Thomas 6,581 12.94 Communist John H Peck 1,331 2.62 Majority 5,053 9.93 Turnout 59,638 85.30 Labour hold Swing General Election 1955: Nottingham North Party Candidate Votes % ±% Labour J Harrison 26,552 55.40 Conservative I G Colvin 20,462 42.69 Communist John H Peck 916 1.91 Majority 6,090 12.71 Turnout 60,234 79.57 See also
Notes and references
- ^ http://www.virginmedia.com/jobs/features/uk-unemployment-blackspots.php?ssid=2
- ^ Leigh Rayment's Historical List of MPs – Constituencies beginning with "N" (part 3)
- ^ "BBC NEWS – Election 2010 – Nottingham North". BBC News. http://news.bbc.co.uk/nol/shared/election2010/results/constituency/d40.stm.
- ^ "BBC NEWS – Election 2005 – Nottingham North". BBC News. http://news.bbc.co.uk/1/shared/vote2005/html/439.stm.
- ^ a b BBC News. http://news.bbc.co.uk/hi/english/static/vote2001/results_constituencies/constituencies/439.stm.
- ^ "Politics Resources". Election 1992. Politics Resources. 9 April 1992. http://www.politicsresources.net/area/uk/ge92/ge92index.htm. Retrieved 2010-12-06.
Constituencies in the East Midlands (46) Conservative (31) Amber Valley · Boston and Skegness · Bosworth · Broxtowe · Charnwood · Corby · Daventry · Derbyshire Dales · Erewash · Gainsborough · Grantham and Stamford · Harborough · High Peak · Kettering · Lincoln · Loughborough · Louth and Horncastle · Mid Derbyshire · Newark · Northampton North · Northampton South · North West Leicestershire · Rushcliffe · Rutland and Melton · Sherwood · Sleaford and North Hykeham · South Derbyshire · South Holland and The Deepings · South Leicestershire · South Northamptonshire · Wellingborough
Labour (15) Ashfield · Bassetlaw · Bolsover · Chesterfield · Derby North · Derby South · Gedling · Leicester East · Leicester South · Leicester West · Mansfield · North East Derbyshire · Nottingham East · Nottingham North · Nottingham South
East Midlands European constituency: Conservative (2) · Labour (1) · UKIP (1) · Liberal Democrats (1)Categories:- Politics of Nottingham
- Parliamentary constituencies in Nottinghamshire
- United Kingdom Parliamentary constituencies established in 1955


Wikimedia Foundation. 2010.