- South Derbyshire (UK Parliament constituency)
-
South Derbyshire County constituency for the House of Commons 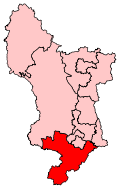
Boundary of South Derbyshire in Derbyshire.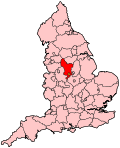
Location of Derbyshire within England.County Derbyshire Electorate 71,326 (December 2010)[1] Major settlements Melbourne, Swadlincote, Repton Current constituency Created 1983 Member of Parliament Heather Wheeler (Conservative) Number of members One Created from Derby North
Derby South
Belper
South East Derbyshire1832–1950 Number of members 1832–1885: Two
1885–1950: OneType of constituency County constituency Created from Derbyshire Overlaps European Parliament constituency East Midlands South Derbyshire is a county constituency represented in the House of Commons of the Parliament of the United Kingdom. It elects one Member of Parliament (MP) by the first past the post system of election.
Contents
Boundaries
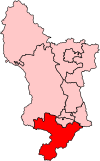 The pre-2010 boundaries of South Derbyshire
South Derbyshire constituency covers parts of Derbyshire to the south of the city of Derby.
The constituency was originally created after the Reform Act in 1832 when Derbyshire was divided into North Derbyshire and South Derbyshire.
The present constituency was created in 1983 from parts of the seats of Derby North, Derby South, Belper, and South East Derbyshire. It was now made up of the District of South Derbyshire, with three wards from the City of Derby (Boulton, Chellaston and Mickleover). In a Boundary Commission report issued in 1995 that came into effect at the 1997 general election, the Mickleover ward was removed to Derby South.
The constituency formally included the South Derbyshire borough with the addition of the City of Derby wards of Boulton and Chellaston. Following the 2010 boundary changes, South Derbyshire loses these Derby wards to become co-terminous with its district.
Constituency profile
This marginal constituency consists of semi-rural villages, including Repton (with its famous public school), that are Tory-voting, plus industrial towns such as Swadlincote that support Labour.
Members of Parliament
MPs 1832–1885
Election First member[2] First party Second member[2] Second party 1832 Hon. George Venables-Vernon Whig The Lord Waterpark Whig 1835 Sir George Harpur Crewe, Bt Tory Sir Roger Gresley, Bt Tory 1837 Francis Hurt Tory 1841 Edward Miller Mundy Conservative Charles Robert Colvile Peelite 1849 by-election William Mundy Conservative 1857 Thomas William Evans Liberal 1859 William Mundy Conservative 1865 Charles Robert Colvile Liberal 1868 Rowland Smith Conservative Sir Thomas Gresley, Bt Conservative 1869 by-election Sir Henry Wilmot, Bt Conservative 1874 Thomas William Evans Liberal 1885 radical boundary changes, reduced to one member MPs 1885–1950
Election Member[2] Party 1885 Henry Wardle Liberal 1892 by-election Harrington Evans Broad Liberal 1895 John Gretton Conservative 1906 Sir Herbert Henry Raphael Liberal 1918 Henry Holman Gregory Coalition Liberal 1922 Henry Dubs Lorimer Conservative 1924 Sir James Augustus Grant Conservative 1929 David Pole Labour 1931 Paul Emrys-Evans Conservative 1945 Arthur Champion Labour 1950 constituency abolished MPs since 1983
Election Member[2] Party 1983 Edwina Currie Conservative 1997 Mark Todd Labour 2010 Heather Wheeler Conservative Elections
Elections in the 2010s
General Election 2010: South Derbyshire [3] Party Candidate Votes % ±% Conservative Heather Wheeler 22,935 45.5% +8.1 Labour Michael Edwards 15,807 31.4% -11.5 Liberal Democrat Alexis Diouf 8,012 15.9% +3.0 BNP Peter Jarvis 2,193 4.3% +0.3 UKIP Charles Swabey 1,206 2.4% +2.4 Socialist Labour Paul Liversuch 266 0.5% +0.5 Majority 7,128 14.1 Turnout 50,419 71.4% +4.5 Conservative gain from Labour Swing -9.8 Elections in the 2000s
General Election 2005: South Derbyshire Party Candidate Votes % ±% Labour Mark Todd 24,823 44.5 −6.2 Conservative Simon Spencer 20,328 36.4 +0.8 Liberal Democrat Deborah Newton-Cook 7,600 13.6 +3.5 BNP David Joines 1,797 3.2 N/A Veritas Edward Spalton 1,272 2.3 N/A Majority 4,495 8.1 Turnout 55,820 65.6 +1.6 Labour hold Swing General Election 2001: South Derbyshire Party Candidate Votes % ±% Labour Mark Todd 26,338 50.7 -3.8 Conservative James Hakewill 18,487 35.6 +4.3 Liberal Democrat Russell Eagling 5,233 10.1 +1.1 UKIP John Blunt 1,074 2.1 +1.1 Socialist Labour Paul Liversuch 564 1.1 Independent James Taylor 249 0.5 Majority 7,851 15.1 Turnout 51,945 64.1 -14.1 Labour hold Swing Elections in the 1990s
General Election 1997: South Derbyshire Party Candidate Votes % ±% Labour Mark Todd 32,709 54.5 +10.5 Conservative Edwina Currie 18,742 31.3 -15.9 Liberal Democrat Rob Renold 5,408 9.0 +0.7 Referendum Party R. A. E. North 2,491 4.2 N/A UKIP I. E. Crompton 617 1.0 N/A Majority 13,967 23.2 Turnout 78.2 Labour gain from Conservative Swing General Election 1992: South Derbyshire[4] Party Candidate Votes % ±% Conservative Edwina Currie 34,266 48.7 −0.4 Labour Mark Todd 29,608 42.1 +8.8 Liberal Democrat Ms. DJ Brass 6,236 8.9 −8.8 Natural Law TW Mercer 291 0.4 +0.4 Majority 4,658 6.6 −9.2 Turnout 70,401 84.7 +3.4 Conservative hold Swing −4.6 "
Elections in the 1980s
General Election 1987: South Derbyshire Party Candidate Votes % ±% Conservative Edwina Currie 31,927 49.1 Labour J. D. Whitby 21,616 33.2 Social Democrat J. Edgar 11,509 17.7 Majority 10,311 15.9 Turnout 81.3 Conservative hold Swing General Election 1983: South Derbyshire Party Candidate Votes % ±% Conservative Edwina Currie 25,909 43.8 N/A Labour P. Kent 17,296 29.2 N/A Social Democrat Roderick MacFarquhar 15,959 27.0 N/A Majority 8,613 14.6 N/A Turnout 78.5 N/A Conservative hold Swing N/A Elections in the 1940s
General Election 1945: South Derbyshire Party Candidate Votes % ±% Labour Arthur Champion 47,586 57.7 Conservative Paul Emrys-Evans 24,636 29.9 Liberal N. Heathcote 10,255 12.4 Majority 22,950 27.8 N/A Turnout 82,477 N/A Labour gain from Conservative Swing N/A See also
References
- ^ "Electorate Figures - Boundary Commission for England". 2011 Electorate Figures. Boundary Commission for England. 4 March 2011. http://www.boundarycommissionforengland.org.uk/electoral-figures/electoral-figures.htm. Retrieved 13 March 2011.
- ^ a b c d Leigh Rayment's Historical List of MPs – Constituencies beginning with "D" (part 1)
- ^ http://ukpollingreport.co.uk/guide/seat-profiles/derbyshiresouth, UKPollingReport
- ^ "Politics Resources". Election 1992. Politics Resources. 9 April 1992. http://www.politicsresources.net/area/uk/ge92/ge92index.htm. Retrieved 2010-12-06.
Constituencies in the East Midlands (46) Conservative (31) Amber Valley · Boston and Skegness · Bosworth · Broxtowe · Charnwood · Corby · Daventry · Derbyshire Dales · Erewash · Gainsborough · Grantham and Stamford · Harborough · High Peak · Kettering · Lincoln · Loughborough · Louth and Horncastle · Mid Derbyshire · Newark · Northampton North · Northampton South · North West Leicestershire · Rushcliffe · Rutland and Melton · Sherwood · Sleaford and North Hykeham · South Derbyshire · South Holland and The Deepings · South Leicestershire · South Northamptonshire · Wellingborough
Labour (15) East Midlands European constituency: Conservative (2) · Labour (1) · UKIP (1) · Liberal Democrats (1)Categories:- Parliamentary constituencies in Derbyshire
- United Kingdom Parliamentary constituencies established in 1832
- United Kingdom Parliamentary constituencies disestablished in 1950
- United Kingdom Parliamentary constituencies established in 1983


Wikimedia Foundation. 2010.