- Debt levels and flows
-
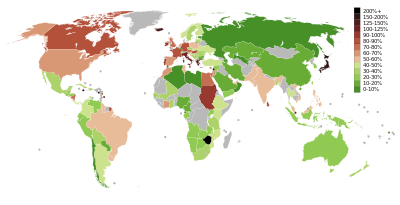 Public debt as a percent of GDP (2010).
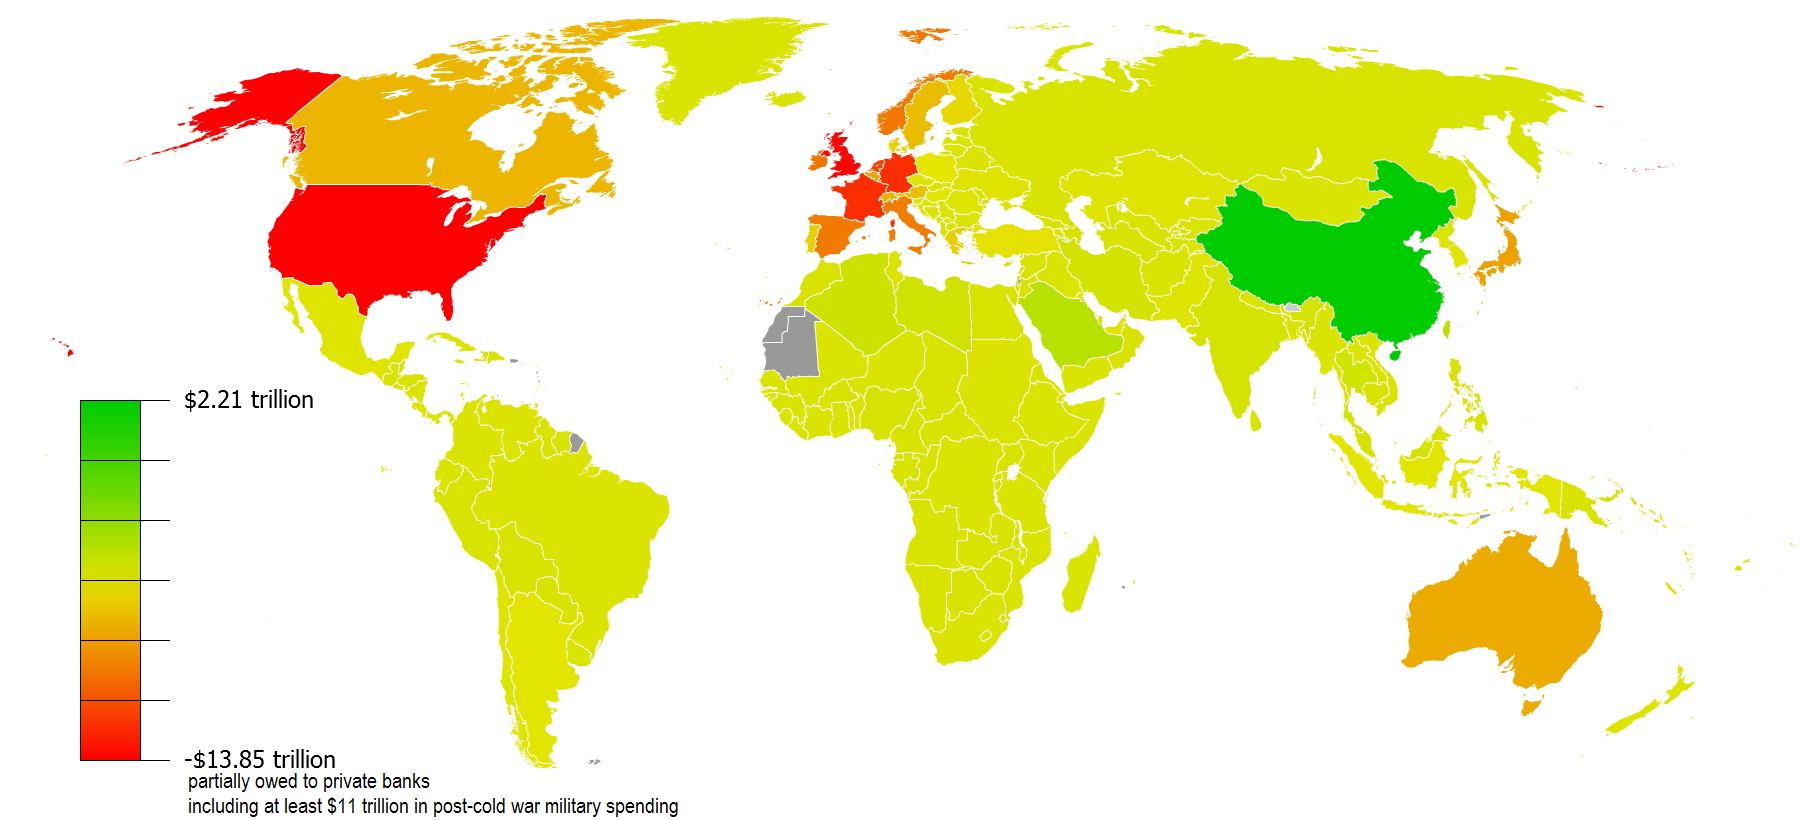
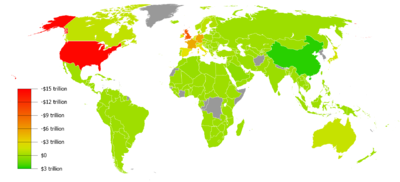 Foreign currency reserves and gold minus external debt based on 2010 data from CIA Factbook.
Debt is used to finance and pay for entreprises and business around the world. The levels of debt – how much debt is outstanding – and the flows of debt – how much the level of debt changes over time – are basic macroeconomic data, and vary between countries.
Within mainstream economics, levels and flows of public debt (government debt) are a cause of concern, while levels and flows of private debt (especially households and corporations) is not seen as being of central importance.
Contents
Measuring debt
In measuring debt, stocks and flows are both of interest: stocks are amounts, levels of debt (e.g., $100) and have units of currency (such as US Dollars), while flows are changes in levels – in calculus terms, the derivative – (e.g., $10/year), and have units of currency/time (such as US Dollars/Year).
In order to make these stock and flows comparable between countries and across time, one may normalize these by some measure of the size of the country's economy, most often GDP, that is, compute the debt to GDP ratio. For instance, $10 billion in 2000 is a small amount of debt relative to the size of the economy of the United States, but large relative to the size of the economy of Iceland, and dividing by the GDP reflects this.
Because GDP is generally quoted with units of currency/year, and debt levels have units of currency, the debt level/GDP ratio has units of years, which may be interpreted as "how many years it would take to repay the debt if all income went to debt repayment". In practice this cannot happen – some of GDP must go to survival – and historically debt repayment rates during periods of repayment have been about 4%–10% of GDP (as in the United States during the Great Depression and World War II),[citation needed] so practical time to repay debt is rather Debt/GDP times 10–25.
Overall levels
Debt levels are worth 3 years of GDP in many countries that have an annual GDP/person above $10,000. Worldwide debt levels are perhaps worth two or three years of GDP.[weasel words] GDP (at currency exchange rate) was $40 trillion during 2004. Debt levels may therefore be about $100 trillion.[weasel words]
$5.7 trillion of gross debt was issued in 2004 according to Thomson Financial numbers, while GDP grew $4 trillion (currency exchange rate). That does not mean that net debt grew faster than GDP on a worldwide average (even if it has done so for years after 2001 in the USA), as debt issuance may be refinancing of existing debt, often "rolling over" debt that comes due into new debt. When debt matures new debt is many times issued to repay the old debt, perhaps from the same creditor. That is one reason why debt issuance far surpasses equity issuance in currency value.
Debt is often issued with a repayment plan (a "time to maturity" in some cases), repayment times may be between a few days (interbank cash flow management) and 50 years or longer (consumer real estate debt). The average repayment time of all worldwide outstanding debt is perhaps[weasel words] 10 years.[citation needed]
Equity is another way of financing business, as it has no set time to maturity and pays no set interest. It pays profit from the company it has a claim on.
Accounting
All credit is debt, a liability. Debt is created by lenders and borrowers agreeing to exchange the use of money for the promise to repay. The unit of money lent is the asset of the creditor and the liability of the debtor.
Notes are paper with terms of exchange, hence credits or access to money. All currencies are notes ("This note is legal tender for..."). Money is based on a fiat whereupon all agree upon the exchange values of similar pieces of paper. This extends to savings and checking accounts which are depository receipts for money loaned to bankers who in turn lend it to other borrowers. And thus it multiplies, a deposit becomes a loan that becomes another deposit and so on.
The terms of the lending agreement are the key elements of the contractual terms of a promissory note regarding repayment including the amount(s) loaned and to be repaid, loan fees, time value and risk value interest charges, due dates, balloon payments, default terms and more. All material information should be disclosed on financial statements or footnotes.
Flows
2004
Worldwide debt and equity underwriting reached a record $5.69 trillion. Worldwide debt underwriting grew 4.3% year-over-year to $5.19 trillion. Syndicated lending was up 34.3% year-over-year. worldwide high-yield corporate debt climbed to over $163 billion eclipsing the previous record of $150 billion set in 1998. US Asset-backed securities volume increased 41.7% to $857 billion.
Worldwide equity & equity-related issuance totaled $505bn for the year, representing a 29.9% increase over the $389bn raised in 2003. Initial public offerings increased nearly 220%.
2003
Worldwide Debt, Equity and Equity-related issuance reached record-breaking levels with over $5 trillion in proceeds raised, surpassing 2001’s record of $4.4 trillion. The $5 trillion of borrowings represented 14% of the GDP flow during the year (4.938/36.3) (see world economy). 93% of the issuance was debt, 7% was equity. Note that these numbers don't include all mortgage borrowing, which was $3.8 trillion in the United States during 2003. $900 billion of it is in mortgage-backed securities, at least $546 billion in US Federal Credit Agency.
Flows
Flows mean issued and sold debt. Debt and equity issuance reported by Thomson Financial ([1]) ($ billions and number of issues).
Worldwide Debt, Equity & Equity-related
- 2004: 5,693 (20,066) (Q4 2004 report)
- 2003: 5,326 (19,706) (Q4 2003 report)
- 2002: 4,257 (?) (Q4 2003 report)
Worldwide Disclosed Fees
- 2004: 15.401 (6,890) (Q4 2004 report)
- 2003: 14.461 (8,023) (Q4 2003 report)
- 2002: 14.762 (6,696) (Q4 2003 report)
Worldwide Equity and Equity-related
- 2004: 505 (3,628) (Q4 2004 report)
- 2003: 388 (2,418) (Q4 2003 report)
- 2002: 319 (?) (Q4 2003 report)
Worldwide Debt
- 2004: 5,187 (16,439) (Q4 2004 report)
- 2003: 4,938 (17,287) (Q4 2003 report)
- 2002: 3,938 (?) (Q4 2003 report)
Worldwide High Yield Corporate Debt
- 2004: 163 (606) (Q4 2004 report)
- 2003: 146 (524) (Q4 2003 report)
- 2002: 63 (?) (Q4 2003 report)
Worldwide Loans (syndicated, leveraged)
- 2004: 2,640 (7,147) (Q4 2004 report)
- 2003: 1,966 (?) (Q4 2004 report)
- 2002: ? (?) (Q4 2003 report)
Europe
All Euromarket Issues
- 2003: 1,397 (3,568) (Q4 2003 report)
- 2002: 877 (2715) (Q4 2002 report)
European Leveraged Loans
- 2003: 107 (222) (Q4 2003 report)
- 2002: ? (?) (Q4 2002 report)
United States
- 2003: 659 (1,868) (Q4 2003 report)
- 2002: 549 (?) (Q4 2003 report)
All US Federal Credit Agency Debt. FHLB dominated the agency market in 2003, raising $545.5 billion in proceeds, a 35% increase in volume from 2002.
- 2003: 1,191 (13,152) (Q4 2003 report)
- 2003: 923 (?) (Q4 2003 report)
- 2003: 900 (1,203) (Q4 2003 report)
- 2002: 805 (?) (Q4 2003 report)
- 2003: 581 (1,175) (Q4 2003 report)
- 2002: 456 (?) (Q4 2003 report)
US Syndicated Loans
- 2003: 980 (2,962) (Q4 2003 report)
- 2002: 1,051 (?) (Q4 2003 report)
US Leveraged Loans
- 2003: 368 (1,549) (Q4 2003 report)
- 2002: 344 (?) (Q4 2003 report)
Levels
Levels mean market or balance sheet liability of borrowing party (or asset of lending party) value. Numbers are end-of-year levels, unless otherwise stated.
Euro area
Credit market debt
- 2003: ?
Households
- 2004: 86% of households’ gross disposable income [1]
Non-financial corporations
- 2003: 78.9% of GDP
Government
- 2003: 70.7% of GDP
Japan
Credit market debt
- 2003: ?
Households
- 2003: 110.5% of households’ gross disposable income
Non-financial corporations
- 2003: 110.5% of GDP
Government
- 2003: 141.3% of GDP
United States
Main article: Financial position of the United StatesDollar amounts are debt owed by each sector (amounts borrowed by each sector)
Credit market debt
- 2008/Q1: $49.6 trillion (349% of GDP) [2]
Household sector
- 2008/Q1: $13,959.9 billion (99% of GDP) (% of "households’ gross disposable income") [3]
Domestic Financial sectors
- 2008/Q1: $15.9 trillion (112% of GDP)
Nonfinancial corporate business
- 2008/Q1: $6.474 trillion (46% of GDP "Non-financial corporations")
Nonfarm noncorporate business
- 2003: $2.241 trillion
Farm business
- 2003: $208 billion
Government
- 2008/Q1: $7.470 trillion (52.6% of GDP "Government")
Federal government
- 2008/Q1: $5.244 trillion
State and local governments
- 2008/Q1: $2.226 trillion
See also
- Bond (finance)
- Bond market
- Credit bubble
- Debt (loan, credit)
- Debt market (credit market)
- Equity market
- Fixed income
- Government debt
- Securitization
- Structured finance
- World economy
Specific:
References
- ^ Laura Rinaldi and Alicia Sanchis-Arellano (2006-01-01). "Working Paper Series No. 570 (page 8)" (PDF). European Central Bank. http://www.ecb.int/pub/pdf/scpwps/ecbwp570.pdf. Retrieved 2007-02-25.
- ^ "Flow of Funds Accounts of the United States" (PDF). Federal Reserve. 2006-09-19. http://www.federalreserve.gov/RELEASES/z1/20060919/z1.pdf. Retrieved 2007-02-05.
- ^ "Flow of Funds Accounts of the United States" (PDF). Federal Reserve. 2008-06-15. http://www.federalreserve.gov/releases/z1/Current/z1.pdf.
External links
International
Thomson Financial
Europe
ECB
United States
Federal Reserve
Debt Debt instruments Managing debt Bankruptcy · Consolidation · Debt management plan · Debt relief · Debt restructuring · Debt-snowball method · DIP financingDebt collection and evasion Bad debt · Charge-off · Collection agency · Debt bondage · Debt compliance · Debtors' prison · Garnishment · Phantom debt · Strategic default · Tax refund interceptionDebt markets Consumer debt · Corporate debt · Deposit account · Debt buyer · Fixed income · Government debt · Money market · Municipal debt · Securitization · Venture debtDebt in economics Categories:

Wikimedia Foundation. 2010.