- Medicine Hat (federal electoral district)
-
Medicine Hat  Alberta electoral district
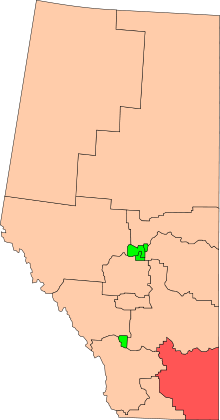
Medicine Hat in relation to the other Alberta federal electoral districts Federal electoral district Legislature House of Commons MP
LaVar Payne
ConservativeDistrict created 1907 First contested 1908 Last contested 2011 District webpage profile, map Demographics Population (2006) 113,085 Electors (2011) 82,528 Area (km²) 33,305 Pop. density (per km²) 3.4 Census divisions Division No. 1, Division No. 2, Division No. 4 Census subdivisions Medicine Hat, Brooks, Redcliff, Newell County, Cypress County, Municipal District of Taber, Bow Island, Bassano, Forty Mile County No. 8, Foremost, Barnwell, Vauxhall, Empress, Special Area No. 2, Tilley, Duchess, Rosemary - For the provincial electoral district by the same name, see Medicine Hat (provincial electoral district).
Medicine Hat is a federal electoral district in Alberta, Canada, that has been represented in the Canadian House of Commons since 1908. The riding covers the City of Medicine Hat and surrounding areas on the southeast side of Alberta – including Cypress County, Forty Mile County, the Municipal District of Taber, the City of Brooks and the County of Newell; and the southern part of Special Area No. 2 south of the Red Deer River.
Contents
History
Soon after the province of Alberta was admitted to Confederation in 1905, this electoral district was created – in 1907 – from Alberta (Provisional District) and Assiniboia West ridings.
Members of Parliament
Current Member of Parliament
Its Member of Parliament is LaVar Payne.
Election results
Canadian federal election, 2011 Party Candidate Votes % ±% Expenditures Conservative LaVar Payne 30,719 71.35 +0.49 New Democrat Dennis Perrier 5,616 13.04 +2.03 Liberal Norm Boucher 4,416 10.26 +3.33 Green Graham Murray 1,868 4.34 -1.80 Christian Heritage Frans Vandestroet 317 0.74 +0.21 Total valid votes/Expense limit 43,055 100.00 Total rejected ballots 119 0.28 +0.03 Turnout 43,055 52.58 +6.38 Eligible voters 81,882 Canadian federal election, 2008 Party Candidate Votes % ±% Expenditures Conservative LaVar Payne 26,950 70.86 -8.8 $68,148 New Democrat Wally Regehr 4,187 11.01 +3.0 $3,110 Liberal Beverley Botter 2,639 6.93 -1.5 $9,755 Green Kevin Dodd 2,338 6.14 +2.3 $183 Independent Dean Shock 971 2.55 – – Not affiliated David S. Patrick 580 1.52 – – Christian Heritage Frans Vandestroet 363 0.95 – – Total valid votes/Expense limit 38,028 100.00 $99,562 Total rejected ballots 97 0.25 +0.04 Turnout 38,125 46.20 -10 Canadian federal election, 2006 Party Candidate Votes % ±% Expenditures Conservative Monte Solberg 35,670 79.71 +3.57 $42,183 Liberal Bev Botter 3,737 8.35 -2.55 $10,367 New Democrat Wally Regehr 3,598 8.04 -1.13 $839 Green Kevin Dodd 1,746 3.90 +0.13 $26 Total valid votes/Expense limit 44,751 100.00 $91,765 Total rejected ballots 96 0.21 -0.04 Turnout 44,847 56 +2 Canadian federal election, 2004 Party Candidate Votes % ±% Expenditures Conservative Monte Solberg 30,241 76.14 -8.23 $33,906 Liberal Bill Cocks 4,331 10.90 +0.43 $12,440 New Democrat Betty Stroh 3,643 9.17 +4.04 $11,008 Green Kevin Dodd 1,498 3.77 – $716 Total valid votes 39,713 100.00 Total rejected ballots 98 0.25 -0.01 Turnout 39,811 53.75 -4.96 Note: Conservative vote is compared to the total of Progressive Conservative and Canadian Alliance vote in 2000.
Canadian federal election, 2000 Party Candidate Votes % ±% Expenditures Canadian Alliance Monte Solberg 31,134 74.27 +8.83 $37,263 Liberal Trevor Butts 4,392 10.47 -7.00 $3,972 Progressive Conservative Gordon Musgrove 4,236 10.10 -2.03 $2,521 New Democrat Luke Lacasse 2,153 5.13 +0.19 $5,220 Total valid votes 41,915 100.00 Total rejected ballots 111 0.26 +0.04 Turnout 42,026 58.71 +5.15 Note: Canadian Alliance vote is compared to the Reform vote in 1997.
Canadian federal election, 1997 Party Candidate Votes % ±% Expenditures Reform Monte Solberg 22,761 65.44 +10.75 $32,848 Liberal Glenn Ennis 6,079 17.47 -3.39 $28,313 Progressive Conservative Gordon Musgrove 4,219 12.13 -4.77 $7,651 New Democrat Jim Driscoll 1,719 4.94 +0.40 $4,923 Total valid votes 34,778 100.00 Total rejected ballots 76 0.22 Turnout 34,854 53.56 Canadian federal election, 1993 Party Candidate Votes % ±% Reform Monte Solberg 22,439 54.69 +43.94 Liberal Glenn Ennis 8,560 20.86 +8.80 Progressive Conservative Bill Wyse 6,934 16.90 -42.02 New Democrat Allan Hunt 1,862 4.54 -10.60 Christian Heritage Ivor Ottrey 971 2.37 -0.76 Canada Party Jack Hopkins 262 0.64 – Total valid votes 41,028 100.00 Canadian federal election, 1988 Party Candidate Votes % ±% Progressive Conservative Robert Harold Porter 25,114 58.92 -16.83 New Democrat Jim Ridley 6,453 15.14 +4.77 Liberal Peter Hansen 5,141 12.06 +3.09 Reform Larry Samcoe 4,582 10.75 – Christian Heritage Hans Visser 1,331 3.12 – Total valid votes 42,621 100.00 Canadian federal election, 1984 Party Candidate Votes % ±% Progressive Conservative Robert Harold Porter 33,978 75.75 +5.44 New Democrat Wally Regehr 4,652 10.37 +1.00 Liberal Peter Hansen 4,025 8.97 -8.56 Confederation of Regions Peter McArthur 1,427 3.18 – Social Credit Jack Hopkins 772 1.72 -1.05 Total valid votes 44,854 100.00 Canadian federal election, 1980 Party Candidate Votes % ±% Progressive Conservative Bert Hargrave 25,908 70.32 -1.94 Liberal Ted Anhorn 6,462 17.54 +0.96 New Democrat Agnes Wiley 3,453 9.37 +1.74 Social Credit Jack Hopkins M. 1,022 2.77 -0.76 Total valid votes 36,845 100.00 Canadian federal election, 1979 Party Candidate Votes % ±% Progressive Conservative Bert Hargrave 28,893 72.25 +17.39 Liberal Jim Wilfley 6,630 16.58 -16.19 New Democrat Lorne L. Burk 3,053 7.63 +0.70 Social Credit Jack Hopkins 1,412 3.53 -1.90 Total valid votes 39,988 100.00 Canadian federal election, 1974 Party Candidate Votes % ±% Progressive Conservative Bert Hargrave 15,525 54.86 +1.16 Liberal H.A. Bud Olson 9,273 32.77 -0.83 New Democrat L. Hemmingway 1,961 6.93 -0.34 Social Credit Edwin Ens 1,538 5.44 +0.01 Total valid votes 28,297 100.00 Canadian federal election, 1972 Party Candidate Votes % ±% Progressive Conservative Bert Hargrave 15,027 53.70 +17.69 Liberal Horace Olson 9,403 33.60 -3.25 New Democrat Lewis E. Toole 2,033 7.27 -2.55 Social Credit D. Willard Paxman 1,519 5.43 -11.89 Total valid votes 27,982 100.00 Canadian federal election, 1968 Party Candidate Votes % ±% Liberal Horace Olson 9,015 36.85 +21.64 Progressive Conservative C.J. Chuck Meagher 8,809 36.01 +8.41 Social Credit W.H. Walt Strom 4,237 17.32 -34.23 New Democrat Lewis E. Toole 2,401 9.82 +4.18 Total valid votes 24,462 100.00 Canadian federal election, 1965 Party Candidate Votes % ±% Social Credit Horace Olson 12,997 51.55 +10.39 Progressive Conservative C.J. Chuck Meagher 6,958 27.60 -12.64 Liberal James C. Miller 3,835 15.21 +1.34 New Democrat Lewis Edward Toole 1,420 5.63 +0.91 Total valid votes 25,210 100.00 Canadian federal election, 1963 Party Candidate Votes % ±% Social Credit Horace Olson 11,080 41.17 -0.23 Progressive Conservative Edwin William Brunsden 10,829 40.24 +3.18 Liberal David R. Broadfoot 3,734 13.87 -1.74 New Democrat John Head 1,271 4.72 -1.21 Total valid votes 26,914 100.00 Canadian federal election, 1962 Party Candidate Votes % ±% Social Credit Horace Olson 10,453 41.40 -4.89 Progressive Conservative Edwin William Brunsden 9,355 37.05 -1.86 Liberal Dave Broadfoot 3,942 15.61 +4.68 New Democrat George McFall 1,499 5.94 +2.08 Total valid votes 25,249 100.00 Canadian federal election, 1958 Party Candidate Votes % ±% Progressive Conservative Edwin William Brunsden 10,886 46.29 +36.07 Social Credit Horace Olson 9,151 38.91 -7.95 Liberal B. Walter 2,572 10.94 -24.93 Co-operative Commonwealth J.D. Rogers 907 3.86 -1.54 Total valid votes 23,516 100.00 Canadian federal election, 1957 Party Candidate Votes % ±% Social Credit Horace Olson 10,960 46.86 -1.14 Liberal Harry Veiner 8,390 35.87 -10.14 Progressive Conservative Edwin William Brunsden 2,391 10.22 +4.23 Co-operative Commonwealth Earl Walter Smith 1,262 5.40 – Ind. Social Credit William Raymond Klinck 386 1.65 – Total valid votes 23,389 100.00 Canadian federal election, 1953 Party Candidate Votes % ±% Social Credit William Duncan Wylie 9,305 48.00 -6.51 Liberal Harry Veiner 8,919 46.01 +13.21 Progressive Conservative John Robertson 1,161 5.99 -6.69 Total valid votes 19,385 100.00 Canadian federal election, 1949 Party Candidate Votes % ±% Social Credit William Duncan Wylie 10,086 54.52 +13.17 Liberal Harry Veiner 6,069 32.80 +4.45 Progressive Conservative Thomas Spencer Hughes 2,346 12.68 -3.53 Total valid votes 18,501 100.00 Canadian federal election, 1945 Party Candidate Votes % ±% Social Credit William Duncan Wylie 6,752 41.34 +4.43 Liberal Robert Clark Black 4,631 28.36 -34.73 Progressive Conservative Philip Rogers 2,647 16.21 Co-operative Commonwealth Earl Walter Smith 2,301 14.09 – Total valid votes 16,331 100.00 Canadian federal election, 1940 Party Candidate Votes % ±% Liberal Frederick William Gershaw 9,439 63.08 +30.43 New Democracy Archibald Hugh Mitchell 5,524 36.92 -15.21 Total valid votes 14,963 100.00 Canadian federal election, 1935 Party Candidate Votes % ±% Social Credit Archibald Hugh Mitchell 6,752 52.13 Liberal Frederick William Gershaw 4,229 32.65 -33.38 Conservative Gilbert McNeill Blackstock 1,971 15.22 -18.75 Total valid votes 12,952 100.00 Canadian federal election, 1930 Party Candidate Votes % ±% Liberal Frederick William Gershaw 6,043 66.03 +16.62 Conservative Gilbert McNeill Blackstock 3,109 33.97 +7.82 Total valid votes 9,152 100.00 Canadian federal election, 1926 Party Candidate Votes % ±% Liberal Frederick William Gershaw 4,206 49.41 -0.29 Conservative Gilbert McNeill Blackstock 2,226 26.15 -1.03 United Farmers Carl Henning Axelson 2,081 24.44 +1.32 Total valid votes 8,513 100.00 Canadian federal election, 1925 Party Candidate Votes % ±% Liberal Frederick William Gershaw 4,383 49.70 +30.60 Conservative George McNeill Blackstock 2,397 27.18 +19.15 Progressive Hugh Campbell McDaniel 2,039 23.12 -49.75 Total valid votes 8,819 100.00 Canadian federal election, 1921 Party Candidate Votes % ±% Progressive Robert Gardiner 10,295 72.87 -6.71 Liberal Frederick William Gershaw 2,698 19.10 Conservative William McIntosh 1,135 8.03 -12.38 Total valid votes 14,128 100.00 By-election on 27 June 1921 On Mr. Sifton's death, 21 January 1921
Party Candidate Votes % ±% Progressive Robert Gardiner 13,133 79.58 Conservative Nelson Spencer 3,369 20.42 -66.57 Total valid votes 16,502 100.00 Canadian federal election, 1917 Party Candidate Votes % ±% Government Arthur Lewis Sifton 6,869 86.98 +43.48 Opposition Clifford Bernardo Reilly 568 7.19 -49.30 Non-Partisan League George Paton 460 5.82 Total valid votes 7,897 100.00 Canadian federal election, 1911 Party Candidate Votes % ±% Liberal William Ashbury Buchanan 6,330 56.49 +9.70 Conservative Charles Alexander Magrath 4,875 43.51 -9.70 Total valid votes 11,205 100.00 Canadian federal election, 1908 Party Candidate Votes % Conservative Charles Alexander Magrath 2,922 53.20 Liberal William Simmons 2,570 46.80 Total valid votes 5,492 100.00 See also
- List of Canadian federal electoral districts
- Alberta federal electoral districts
- Past Canadian electoral districts
Sources
- Library of Parliament Riding Profile
- Expenditures - 2008
- Expenditures - 2004
- Expenditures - 2000
- Expenditures - 1997
External links
- Elections Canada
- Website of the Parliament of Canada
Federal ridings in rural Alberta Conservative Crowfoot • Fort McMurray—Athabasca • Lethbridge • Macleod • Medicine Hat • Peace River • Red Deer • Vegreville—Wainwright • Westlock—St. Paul • Wetaskiwin • Wild Rose • Yellowhead
Federal ridings in the Prairies Rural Manitoba Winnipeg Saskatchewan
(South, North)Battlefords—Lloydminster • Blackstrap • Cypress Hills—Grasslands • Desnethé—Missinippi—Churchill River • Palliser • Prince Albert • Regina—Lumsden—Lake Centre • Regina—Qu'Appelle • Saskatoon—Humboldt • Saskatoon—Rosetown—Biggar • Saskatoon—Wanuskewin • Souris—Moose Mountain • Wascana • Yorkton—MelvilleRural Alberta Crowfoot • Fort McMurray—Athabasca • Lethbridge • Macleod • Medicine Hat • Peace River • Red Deer • Vegreville—Wainwright • Westlock—St. Paul • Wetaskiwin • Wild Rose • YellowheadEdmonton and environs Calgary Categories:

Wikimedia Foundation. 2010.