- Canadian federal election, 1958
-
Canadian federal election, 1958 
1957 ←
membersMarch 31, 1958 → 1962
members265 seats in the 24th Canadian Parliament
133 seats needed for a majorityFirst party Second party 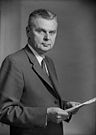
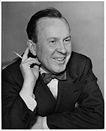
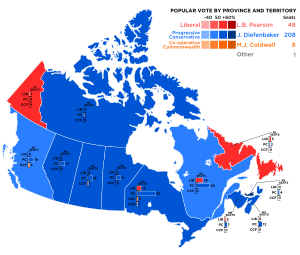
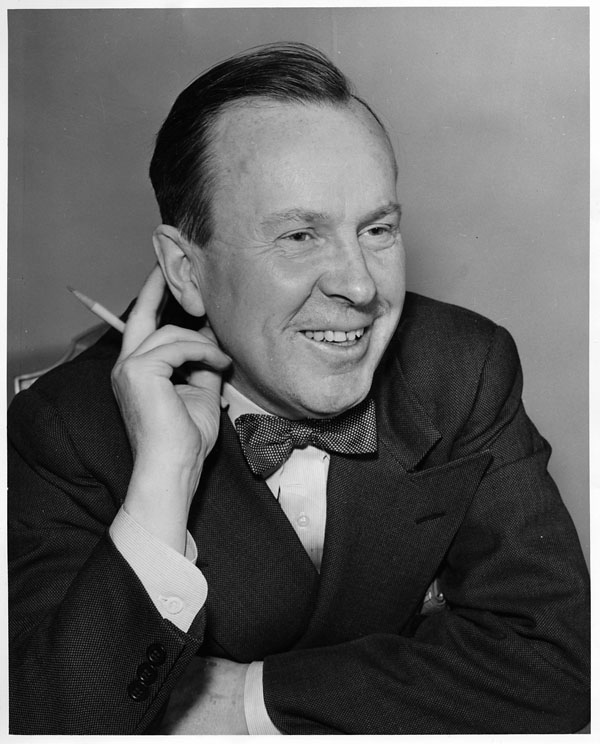
Leader John Diefenbaker Lester B. Pearson Party PC Liberal Leader since 1956 1958 Leader's seat Prince Albert Algoma East Last election 111 104 Seats won 208 48 Seat change +97 -56 Popular vote 3,908,633 2,432,953 Percentage 53.66% 33.40% Swing +14.85% -7.35% Third party Fourth party 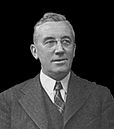
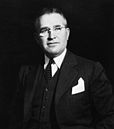
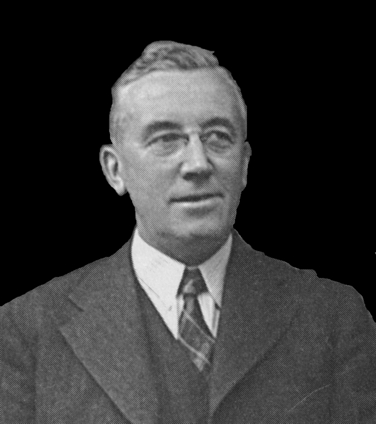
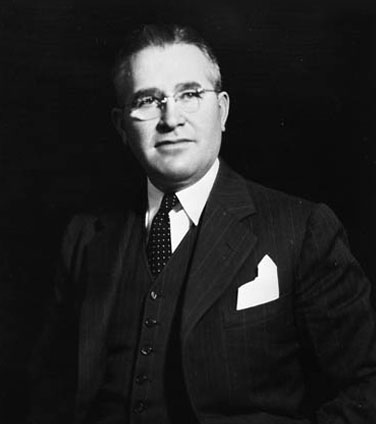
Leader Major James Coldwell Solon Earl Low Party CCF Social Credit Leader since 1942 1944 Leader's seat Rosetown—Biggar (defeated) Peace River
(lost re-election)Last election 25 19 Seats won 8 0 Seat change -17 -19 Popular vote 692,668 188,356 Percentage 9.51% 2.6% Swing -1.20% -4.0%
Prime Minister before election
Prime Minister-designate
The Canadian federal election of 1958 was the 24th general election in Canada's history. It was held to elect members of the Canadian House of Commons of the 24th Parliament of Canada on March 31, 1958, just nine months after the 23rd election. It transformed Prime Minister John Diefenbaker's minority into the largest ever majority government (by percentage of seats) in Canadian history and the second largest percentage of the popular vote.
Contents
Overview
Diefenbaker called a snap election and capitalized on three factors:
- Nationally, the Liberals had just chosen a new leader, Lester Pearson, who had given an ill-advised speech in Commons that asked Diefenbaker to give power back to the Liberals without an election because of a recent economic downturn. Diefenbaker seized on the error by showing a classified Liberal document saying that the economy would face a downturn in that year. This contrasted heavily with the Liberals' 1957 campaign promises, and would make sure the "arrogant" label would remain attached to the Liberal party.
- A turnaround in Quebec: Quebec had been largely Liberal since the Conscription Crisis of 1917, but upon the resignation of former Prime Minister Louis St. Laurent, the province had no favourite son leader, as they had since 1948, and were open to new options. Diefenbaker used Quebec Premier Maurice Duplessis's Union Nationale party machine, allowing Diefenbaker's Progressive Conservatives to sweep what had been a Liberal stronghold for a generation.
- A collapse in support for the Social Credit Party which lost all 19 of its seats. Prior to the 1957 election Social Credit were seen as a credible threat to replace the Tories as the main right wing party in the country, but the popularity of the Diefenbaker government persuaded many Social Credit supporters to abandon their party. This allowed the Tories to pick up not only Social Credit seats, but also proved decisive in many seats previously held by the Liberals and CCF due to vote splitting between the Conservatives and Social Credit. Notably, the Tories swept all seventeen seats in Alberta, where they had previously held just three seats to Social Credit's thirteen. Although Social Credit would rebound and win seats in the next two decades, it would never seriously challenge the P.C. party for dominance.
 PC handout with "Follow John", the slogan of the 1958 campaign.
National results
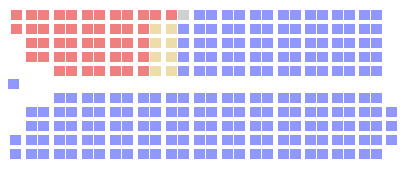
 The Canadian parliament after the 1958 election.
Party Party leader # of
candidatesSeats Popular vote 1957 Elected % Change # % % Change Progressive Conservative John Diefenbaker 265 111 208 +87.4% 3,908,633 53.66% +14.85% Liberal Lester B. Pearson 264 104 48 -53.8% 2,432,953 33.40% -7.35% Co-operative Commonwealth M.J. Coldwell 169 25 8 -68.0% 692,668 9.51% -1.20% Liberal-Labour 1 1 1 0% 11,956 0.16% - Social Credit Solon Low 82 19 - -100% 188,356 2.59% -3.99% Independent 9 2 - -100% 14,211 0.20% -0.87% Independent Liberal 10 2 - -100% 12,054 0.17% -1.25% Labour Progressive Tim Buck 18 - - - 9,769 0.13% +0.02% Candidats des électeurs Réal Caouette 1 - - - 8,276 0.11% -0.01% Independent PC 5 1 - -100% 2,097 0.03% -0.19% Socialist 2 * - * 1,113 0.02% * Capital familial H-G Grenier 1 * - * 968 0.01% * Radical chrétien 1 * - * 687 0.01% * Independent SC 1 - - - 361 x -0.04% Ouvrier canadien 1 * - * 243 x * Independent Conservative 1 * - * 122 x * Total 831 265 265 - 7,284,467 100.00% Sources: http://www.elections.ca History of Federal Ridings since 1867 Notes:
"Previous" refers to standings at previous election, not to standings in the House of Commons at dissolution.
* The party did not nominate candidates in the previous election.
x - less than 0.005% of the popular vote
Results by province
Party name BC AB SK MB ON QC NB NS PE NL NW YK Total Progressive Conservative Seats: 18 17 16 14 67 50 7 12 4 2 1 - 208 Vote (%): 49.4 59.9 51.4 56.7 56.4 49.6 54.1 57.0 62.2 45.2 54.5 42.8 53.7 Liberal Seats: - - - - 14 25 3 - - 5 - 1 48 Vote (%): 16.1 13.7 19.6 21.6 32.1 45.6 43.4 38.4 37.5 54.4 43.3 57.2 33.4 Co-operative Commonwealth Seats: 4 - 1 - 3 - - - - - 8 Vote (%): 24.5 4.4 28.4 19.6 10.5 2.3 1.8 4.5 0.3 0.2 9.5 Liberal-Labour Seats: 1 1 Vote (%): 0.5 0.2 Total Seats 22 17 17 14 85 75 10 12 4 7 1 1 265 Parties that won no seats: Social Credit Vote (%): 9.6 21.6 0.4 1.8 0.3 0.6 0.7 2.6 Independent Vote (%): xx xx 0.1 0.6 0.2 Independent Liberal Vote (%): 0.6 0.2 0.2 Labour Progressive Vote (%): 0.4 0.3 0.1 0.4 0.1 0.1 0.1 C. des électeurs Vote (%): 0.4 0.1 Independent PC Vote (%): 0.1 0.1 xx Socialist Vote (%): xx xx xx Capitale familiale Vote (%): xx xx Radical chrétien Vote (%): xx xx Independent SC Vote (%): 0.1 xx Ouvrier canadien Vote (%): xx xx Ind. Conservative Vote (%): 2.3 xx xx - less than 0.05% of the popular vote
See also
- List of Canadian federal general elections
- List of political parties in Canada
- 24th Canadian Parliament
References
External links
 Canadian federal elections and referendums
Elections Referendums Federal political parties · Federal electoral districts · Historical federal electoral districts · By-electionsCategories:- Canadian federal elections by year
- 1958 elections in Canada
- Snap elections


Wikimedia Foundation. 2010.