- Demographics of Eritrea
-
The demographics of Eritrea describes the condition and overview of Eritrea's inhabitants. Demographic topics include basic education, health and population statistics, as well as identified ethnic and religious affiliations.
Contents
Ethnic groups

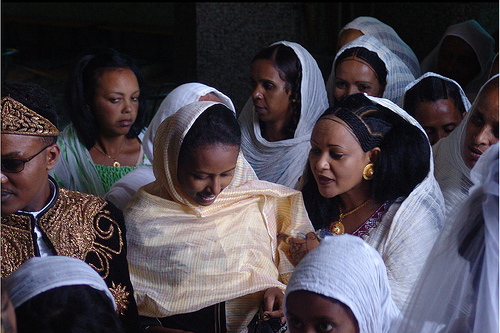
Eritrean society is ethnically heterogeneous. An independent census has yet to be conducted, but the Tigrinya people make up about 60% and Tigre people make up about 30% of the population. These form the bulk of the country's predominantly Semitic-speaking population.
Most of the rest of the population belong to other Afro-Asiatic-speaking communities of the Cushitic branch, such as the Saho, Hedareb, Afar and Bilen.
There are also a number of Nilotic ethnic minorities who are represented in Eritrea by the Kunama and Nara. Each ethnicity speaks a different native tongue but, typically, many of the minorities speak more than one language.
In addition, there exist Italian Eritrean (concentrated in Asmara) and Ethiopian Tigrayan communities. Neither is generally given citizenship unless through marriage or, more rarely, by having it conferred upon them by the State.
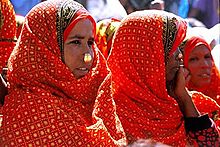
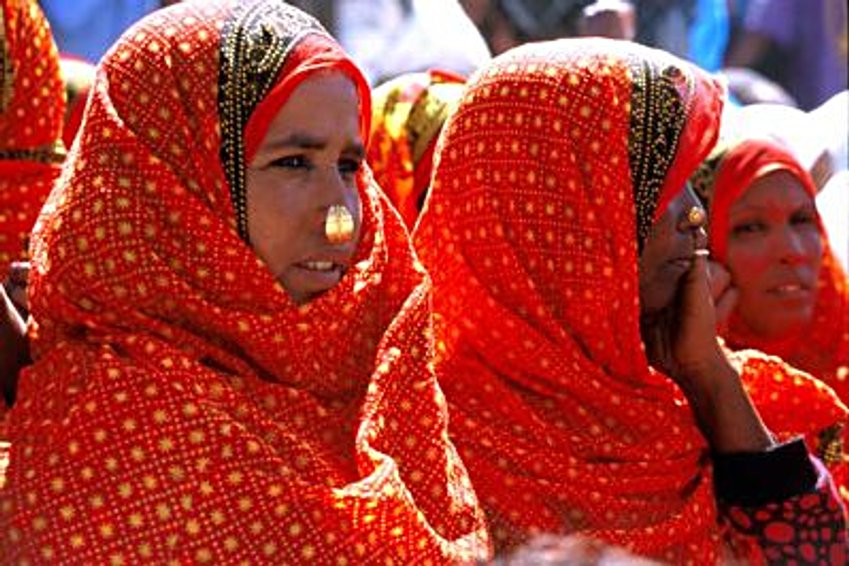
The most recent addition to the nationalities of Eritrea is the Rashaida. The Rashaida came to Eritrea in the 19th century from the Arabian Coast.[1]
Languages
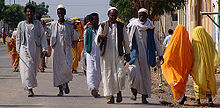
Eritrea's population comprises nine ethnic groups, most of whom speak languages from the Semitic branch of the Afro-Asiatic language family. The Semitic languages in Eritrea are Tigre, Tigrinya, the newly-recognized Dahlik, and Arabic (spoken natively by the Rashaida Arabs).
Other Afro-Asiatic languages belonging to the Cushitic branch are also widely spoken in the country.[2] The latter include Afar, Beja, Blin and Saho.
In addition, languages belonging to the Nilo-Saharan language family (Kunama and Nara) are also spoken as a mother tongue by the Kunama and Nara Nilotic ethnic minorities that live in the north and northwestern part of the country.[2]
English is also spoken and is the language used for secondary and university education.
Religion
In general, most of the Christians live in the highlands, while Muslims and adherents of other beliefs live in the lowland regions.
CIA World Factbook demographic statistics
The following demographic statistics are from the CIA World Factbook, unless otherwise indicated. Population: 5,060,620 Age structure:
0–14 years: 42.9% (male 1,085,116/female 1,072,262)
15–64 years: 53.5% (male 1,332,349/female 1,355,494)
65 years and over: 3.6% (male 88,068/female 95,186) (2008 est.)Population growth rate: 2.447% (2008 est.)
Birth rate: 33.62 births/1,000 population (2008 est.)
Death rate: 9.15 deaths/1,000 population (2008 est.)
Net migration rate: NA (2008 est.) * 0 migrant(s)/1,000 population (2006 est.)
Sex ratio:
at birth: 1.03 male(s)/female
under 15 years: 1.01 male(s)/female
15–64 years: 0.98 male(s)/female
65 years and over: 0.93 male(s)/female
total population: 0.99 male(s)/female (2008 est.)Infant mortality rate: 44.22 deaths/1,000 live births
Life expectancy at birth:
total population: 60.05 years
male: 58.29 years
female: 61.87 years (2008 est.)Total fertility rate:
- 4.84 children born/woman (2008 est.)
- 4.6 children born/woman (2010 est.)
Nationality:
noun: Eritrean(s)
adjective: EritreanEthnic groups: There are 9 ethnic groups: Afar, Bilen, Hedareb (Beja), Kunama, Nara, Rashaida, Saho, Tigre and Tigrinya.
Planning Office, Ministry of Education, Asmara, Eritrea (1996)[3]: Tigrinya 50%, Tigre 31.0%, Saho 5.0%, Afar 5.0%, Hedareb (Beja) 2.5%, Rashaida 2.4%, Bilen 2.0%, Kunama 2.0%, and Nara 1.5%.
Religions: Eritrean Orthodox, Sunni Muslim, Roman Catholic, Protestant (see Religion in Eritrea)
Languages: Afar, Arabic (spoken by the Rashaida), Beja (spoken by the Hedareb), Blin, Kunama, Nara, Saho, Tigre, Tigrinya, English as a second language. Tigrinya and Arabic are the foremost second languages.
Literacy:
definition: age 15 and over can read and write
total population: 58.6%
male: 69.9%
female: 47.6% (2003 est.)See also
References
- ^ Alders, Anne. "the Rashaida". http://www.eritreanbeauty.com/r.html. Retrieved 2006-06-07.
- ^ a b Minahan, James (1998). Miniature empires: a historical dictionary of the newly independent states. Greenwood Publishing Group. pp. 76. ISBN 0313306109. http://books.google.ca/books?id=RSxt-JB-PDkC&pg=PA76#v=onepage&q&f=false. ""The majority of the Eritreans speak Semitic or Cushitic languages of the Afro-Asiatic language group. The Kunama, Baria, and other smaller groups in the north and northwest speak Nilotic languages.""
- ^ Tekle M. Woldemikael, "Language, Education, and Public Policy in Eritrea" in African Studies Review, vol. 46, p. 120, 2003.
 This article incorporates public domain material from the CIA World Factbook document "2008 edition".
External links
Demographics of Africa Sovereign
states- Algeria
- Angola
- Benin
- Botswana
- Burkina Faso
- Burundi
- Cameroon
- Cape Verde
- Central African Republic
- Chad
- Comoros
- Democratic Republic of the Congo
- Republic of the Congo
- Côte d'Ivoire (Ivory Coast)
- Djibouti
- Egypt
- Equatorial Guinea
- Eritrea
- Ethiopia
- Gabon
- The Gambia
- Ghana
- Guinea
- Guinea-Bissau
- Kenya
- Lesotho
- Liberia
- Libya
- Madagascar
- Malawi
- Mali
- Mauritania
- Mauritius
- Morocco
- Mozambique
- Namibia
- Niger
- Nigeria
- Rwanda
- São Tomé and Príncipe
- Senegal
- Seychelles
- Sierra Leone
- Somalia
- South Africa
- South Sudan
- Sudan
- Swaziland
- Tanzania
- Togo
- Tunisia
- Uganda
- Zambia
- Zimbabwe
States with limited
recognition- Sahrawi Arab Democratic Republic
- Somaliland
Dependencies and
other territories- Canary Islands / Ceuta / Melilla / Plazas de soberanía (Spain)
- Madeira (Portugal)
- Mayotte / Réunion (France)
- Saint Helena / Ascension Island / Tristan da Cunha (United Kingdom)
- Western Sahara
 Eritrea topics
History Geography Politics Economy Agriculture · Energy · Tourism · Eritrean nakfa · Communications · Companies · Transport · Trade unions · HealthDemographics Culture Portal Categories:- Eritrean society

Wikimedia Foundation. 2010.