- Demographics of Tanzania
-
This article is about the demographic features of the population of Tanzania, including population density, ethnicity, education level, health of the populace, economic status, religious affiliations and other aspects of the population.
Population distribution in Tanzania is extremely uneven. Density varies from 1 person per square kilometre (3 per sq. mi.) in arid regions to 51 per square kilometre (133 per sq. mi.) in the mainland's well-watered highlands to 134 per square kilometre (347 per sq. mi.) on Zanzibar. More than 80% of the population is rural. Dar es Salaam is the capital and largest city; Dodoma, located in the centre of Tanzania, has been designated the new capital, although action to move the capital has stalled.
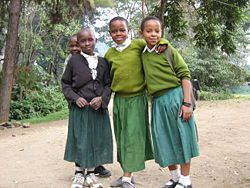
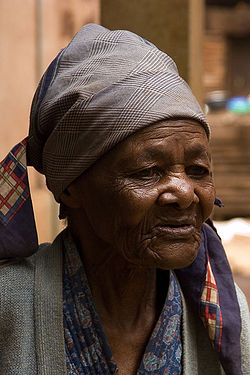
The African population consists of more than 120 ethnic groups, of which the Sukuma, Haya, Nyakyusa, Nyamwezi, and Chagga have more than 1 million members. The majority of Tanzanians, including such communities as the Hehe, Sukuma and the Nyamwezi, are Bantu speaking groups. Groups of Nilotic or related origin include the nomadic Maasai and the Luo, both of which are found in greater numbers in neighbouring Kenya. Two small groups speak languages of the Khoisan family peculiar to the Bushman and Khoikhoi peoples. Cushitic-speaking peoples, originally from the Ethiopian highlands, reside in a few areas of Tanzania. Other Bantu speaking were refugees from Mozambique.
Although much of Zanzibar's African population came from the mainland, one group known as Shirazis traces its origins to the island's early Persian settlers. Non-Africans residing on the mainland and Zanzibar account for 1% of the total population. The Asian community, including Hindus, Sikhs, Shi'a and Sunni Muslims, Parsis and Goans, has declined by 50% in the past decade to 50,000 on the mainland and 4,000 on Zanzibar. An estimated 70,000 Arabs and 20,000 Europeans (90% of which are Anglo-African) reside in Tanzania.
Generally, each ethnic group has its own language, but the national language is Swahili, a Bantu language with a strong Arabic influence, and more recently a large number of English borrowings. The other official language is English. Other spoken languages are Indian languages and Portuguese (both spoken by Mozambican blacks and Goans).
Some 45,000 Tanzanian-born people are currently living abroad, the overwhealming majority of these reside in the United Kingdom (over 32,000), whilst thousands also live in Canada, the United States and various European nations.[1]
CIA World Factbook demographic statistics
The following demographic statistics are from the CIA World Factbook, unless otherwise indicated.[2]
Population
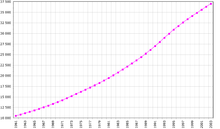
- 42,746,620 (July 2011 est.)
Note: Estimates for this country explicitly take into account the effects of increased mortality due to AIDS; this can result in lower life expectancy, higher infant mortality and death rates, lower population and growth rates, and changes in the distribution of population by age and sex than would otherwise be expected (July 2010 estimate).Age structure
0–14 years: 44.3% (male 7,988,898; female 7,938,979)
15–64 years: 53.1% (male 9,429,959; female 9,634,102)
65 years and over: 2.6% (male 405,803; female 524,713) (2003 est.)
0–14 years: 43% (male 8,853,529/female 8,805,810)
15–64 years: 54.1% (male 10,956,133/female 11,255,868)
65 years and over: 2.9% (male 513,959/female 663,233) (2009 est.)Median age
total: 17.8 years
male: 17.6 years
female: 18.1 years (2008 est.)Population growth rate
2.002% (2011 est.)
Birth rate
32.64 births/1,000 population (2011 est.)
Death rate
12.09 deaths/1,000 population (2011 est.)
Net migration rate
-0.53 migrant(s)/1,000 population (2011 est.)
Sex ratio
at birth: 1.03 male(s)/female
under 15 years: 1.01 male(s)/female
15–64 years: 0.98 male(s)/female
65 years and over: 0.77 male(s)/female
total population: 0.98 male(s)/female (2011 est.)Infant mortality rate
total: 70.46 deaths/1,000 live births
female: 63.19 deaths/1,000 live births (2008 est.)
male: 77.51 deaths/1,000 live birthsLife expectancy at birth
total population: 51.45 years
male: 50.06 years
female: 52.88 years (2008 est.)Total fertility rate
4.16 children born/woman (2011 est.)
HIV/AIDS - adult prevalence rate
5.7% of adults are HIV-positive: 6.6% of women and 4.6% of men are infected (2007-2008 [3]).
HIV/AIDS - people living with HIV/AIDS
1.4 million (2009 est.)
HIV/AIDS - deaths
86,000 (2009 est.)
Ethnic groups
Approximately ninety-nine percent of Tanzanian citizens who live on the mainland are Native African, well over half of whom are members of Bantu language and tribal groups. The remaining one per cent is made up of Asian-Africans largely of Indian descent, European settlers, and Arabs (Many of whom are the results of mixed Arab and African ancestry).
Under the leadership of Julius Nyerere, the Tanzanian government guaranteed equal representation for all Tanzanian people, regardless of race of ethnic origins. Asian-Africans, who are known for their shrewd managagement, are a significant minority of the population in particular and own many small businesses. The generally affluent white population of European descent also numbers some 20,000 to 22,000. Although a few can trace their ancestry back to Tanzania's original German colonials, most are English-speaking with British roots. Like the Arabs, their community congregates largely in the coastal cities.
Shortly after Tanzania gained independence, many Europeans were encouraged to stay on permanently, possibly because their unique skillset as administrators, commercial farmers, and professionals were still very much needed in the new nation.
Religions
Main article: Religion in TanzaniaIt is estimated that approximately 45% of the Tanzanian population are Christians, with Muslims making up approximately 38-40%. The remainder of the population is Hindus, Buddhists, animists, and atheists. Most Christians are Roman Catholic, Lutheran or Seventh-Day Adventist, though a number of other Pentecostal churches, Anglicans and Eastern Orthodox are also represented in the country. Most Tanzanian Muslims are Sunni, though there are also populations of Shia, Ahamadiya, Bohora and Sufi. Muslims are concentrated in coastal areas and in mainland areas along former slave routes.
Languages
Swahili or Kiswahili (official), Kiunguja (name for Swahili in Zanzibar), English (official, primary language of commerce, administration, and higher education), Arabic (widely spoken in Zanzibar), many local languages (see also:Category:Languages of Tanzania)
note: Swahili is the mother tongue of the Bantu speaking people living in Zanzibar and nearby coastal Tanzania; although Swahili is Bantu in structure and origin, its vocabulary draws heavily on a variety of sources, including Arabic and English, and it has become the lingua franca of central and eastern Africa; the first language of most people is one of the local languages.Literacy
definition: age 15 and over can read and write Swahili, English, or Arabic
total population: 78.2%
male: 85.9%
female: 70.7% (2003 est.)See also
- List of ethnic groups in Tanzania
- Europeans in Tanzania
References
 This article incorporates public domain material from the CIA World Factbook document "2003 edition".
Demographics of Africa Sovereign
states- Algeria
- Angola
- Benin
- Botswana
- Burkina Faso
- Burundi
- Cameroon
- Cape Verde
- Central African Republic
- Chad
- Comoros
- Democratic Republic of the Congo
- Republic of the Congo
- Côte d'Ivoire (Ivory Coast)
- Djibouti
- Egypt
- Equatorial Guinea
- Eritrea
- Ethiopia
- Gabon
- The Gambia
- Ghana
- Guinea
- Guinea-Bissau
- Kenya
- Lesotho
- Liberia
- Libya
- Madagascar
- Malawi
- Mali
- Mauritania
- Mauritius
- Morocco
- Mozambique
- Namibia
- Niger
- Nigeria
- Rwanda
- São Tomé and Príncipe
- Senegal
- Seychelles
- Sierra Leone
- Somalia
- South Africa
- South Sudan
- Sudan
- Swaziland
- Tanzania
- Togo
- Tunisia
- Uganda
- Zambia
- Zimbabwe
States with limited
recognition- Sahrawi Arab Democratic Republic
- Somaliland
Dependencies and
other territories- Canary Islands / Ceuta / Melilla / Plazas de soberanía (Spain)
- Madeira (Portugal)
- Mayotte / Réunion (France)
- Saint Helena / Ascension Island / Tristan da Cunha (United Kingdom)
- Western Sahara
 Tanzania topics
History Politics Geography Economy and infrastructure Airports · Bank of Tanzania · Communications · Tanzanian shilling · Tourism · Transport · Water supply and sanitationDemographics and society Culture Zanzibar Portal Categories:
Wikimedia Foundation. 2010.


