- Demographics of Swaziland
-
This article is about the demographic features of the population of Swaziland, including population density, ethnicity, education level, health of the populace, economic status, religious affiliations and other aspects of the population.
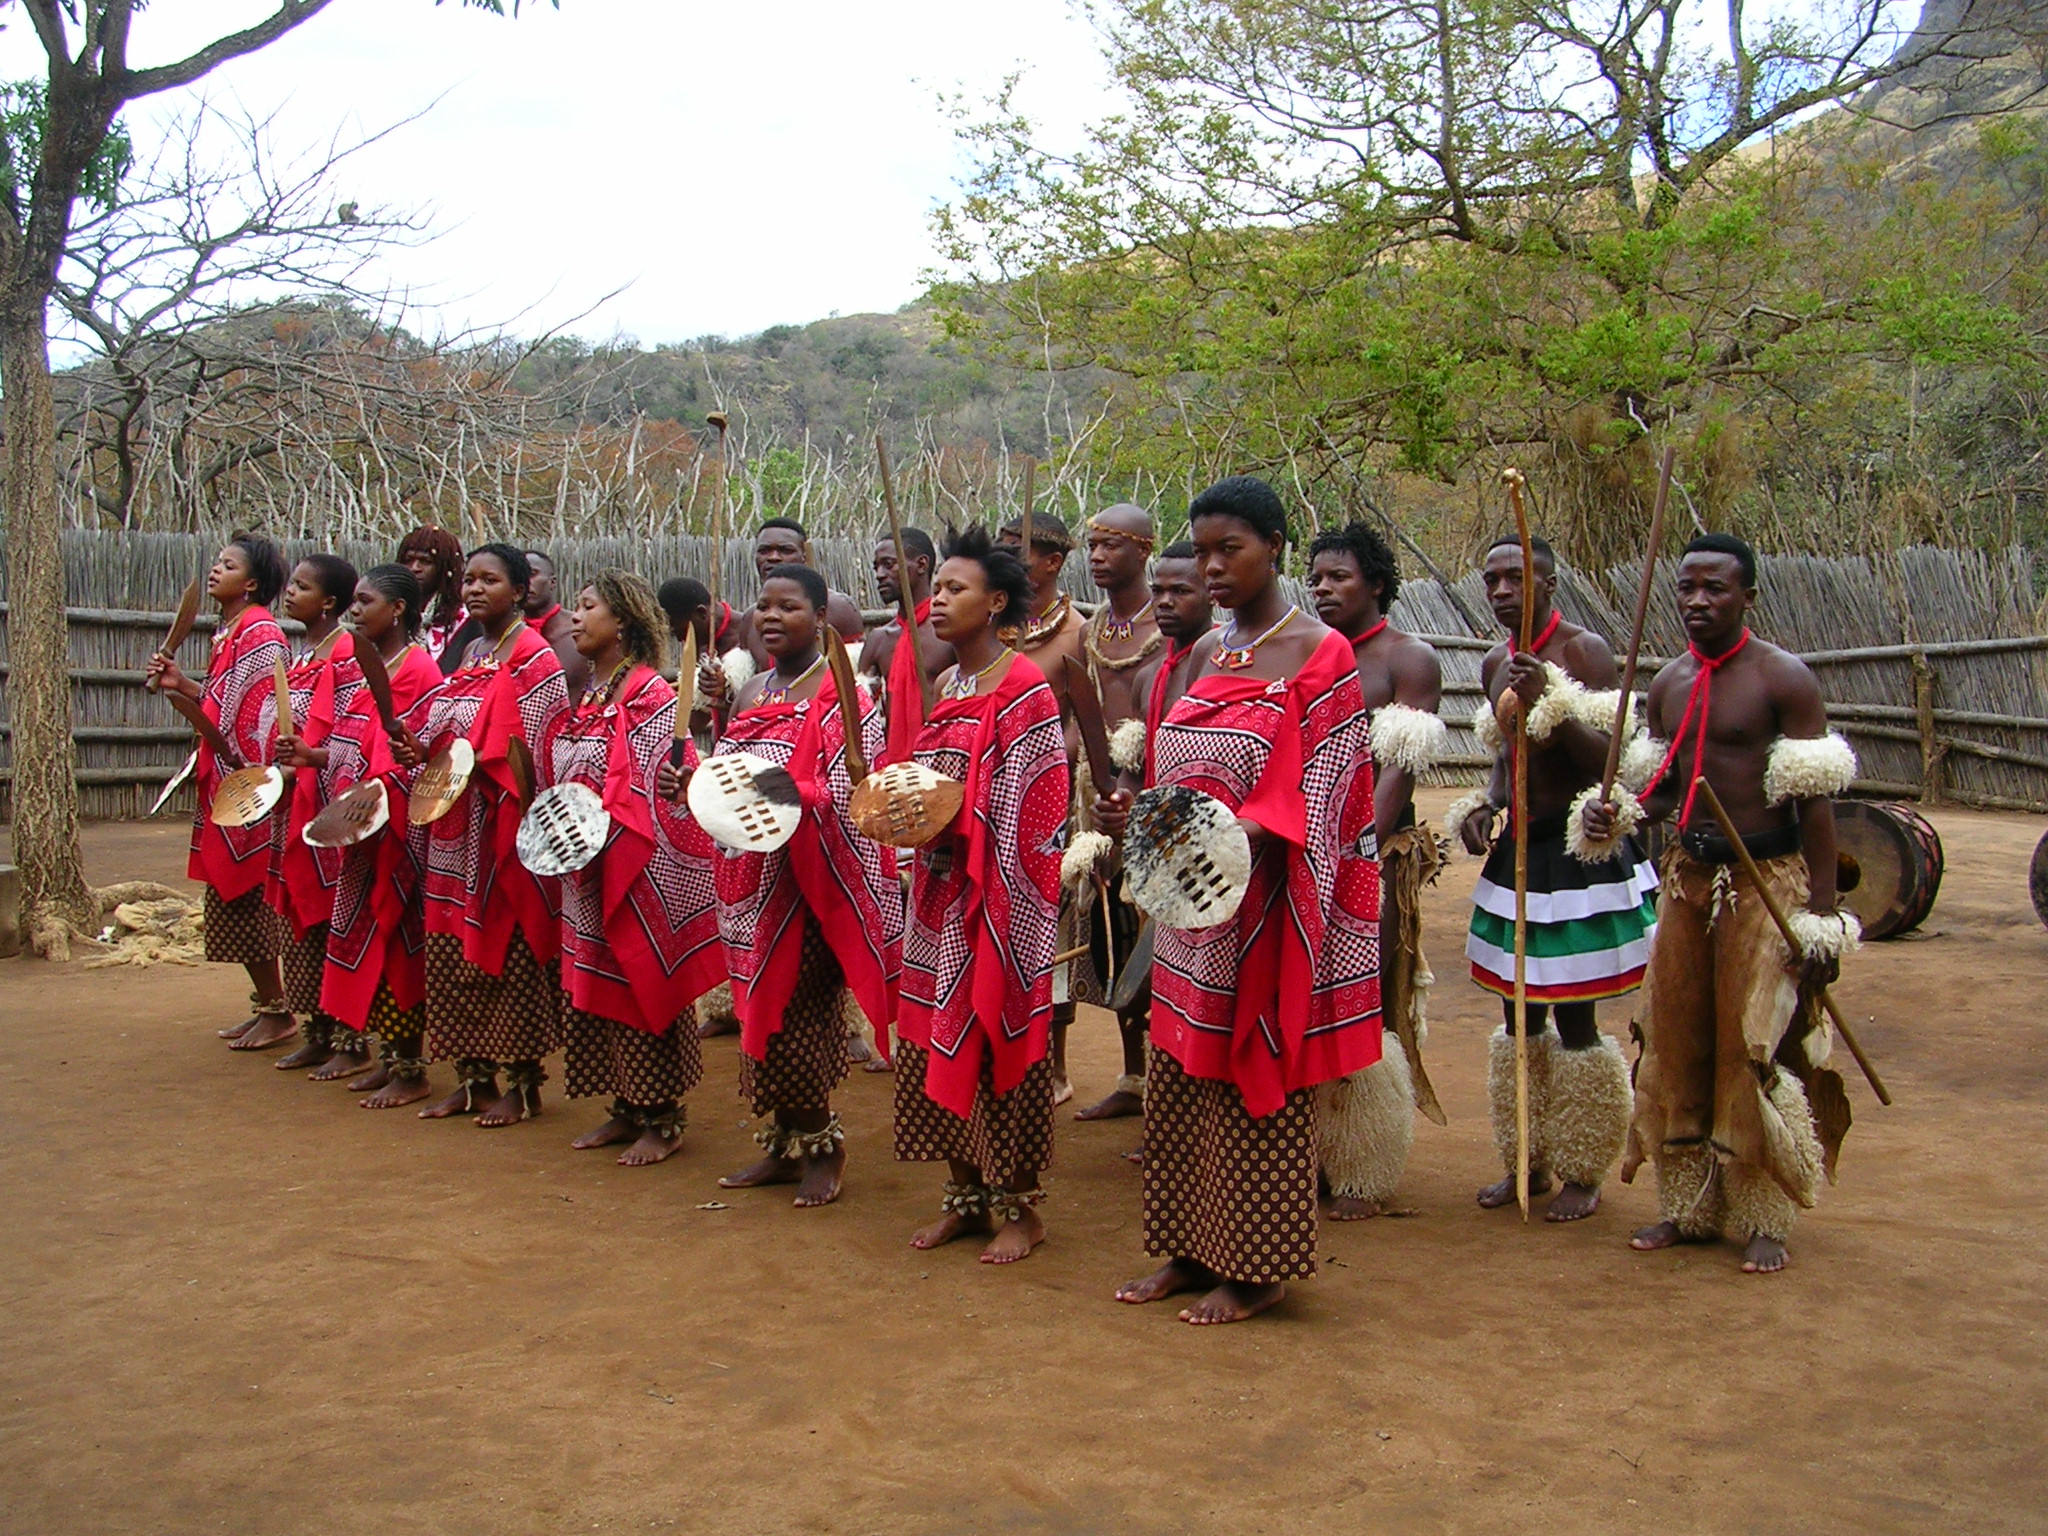
 Swazi people dancing in a cultural village show.
The majority of Swaziland's population is ethnic Swazi, mixed with a small number of Zulus and white Africans, mostly whites of British and Afrikaner descent. This population also includes a small segment within it that is mixed with any number of these ancestries.
Traditionally Swazis have been subsistence farmers and herders, but most now work in the growing urban formal economy and in government. Some Swazis work in the mines in South Africa. Swaziland also received Portuguese settlers and black refugees from Mozambique. Christianity in Swaziland is sometimes mixed with traditional beliefs and practices. Most Swazis ascribe a special spiritual role to the Swazi Royal Family.
The country's official languages are Siswati (a language related to Zulu) and English. Government and commercial business is conducted mainly in English. Asians, Afrikaners, Portuguese, and black Mozambicans speak their own languages.
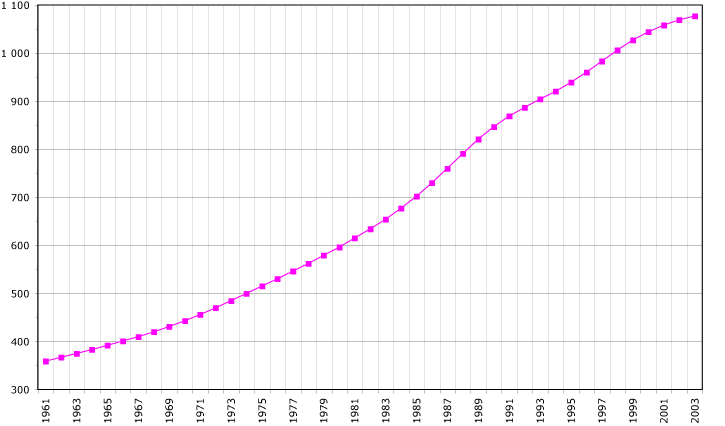
 Demographics of Swaziland, Data of FAO, year 2005 ; Number of inhabitants in thousands.
CIA World Factbook demographic statistics
The following demographic statistics are from the CIA World Factbook, unless otherwise indicated.
Population
1,337,186 (July 2009 est.),[1] 1,161,219 (July, 2003 est.), 1,083,289 (July, 2000 est.)
note: Estimates for this country explicitly take into account the effects of excess mortality due to AIDS; this can result in lower life expectancy, higher infant mortality and death rates, lower population and growth rates, and changes in the distribution of population by age and sex than would otherwise be expected.The 2007 Census put the nation's population at 912,229. This number is lower than the 1997 Census, which gave 929,718 residents. The small difference is believed to be the result of massive emigration of Swazis to South Africa in search of work.[2]
Age structure
0-14 years: 46% (male 245,626; female 247,825) (2000 est.), 41.4% (male 242,762; female 238,141) (2003 est.), 38.6% (male 260,840/female 254,781) (2010 est.)
15-64 years: 52% (male 270,308; female 291,884) (2000 est.), 55.1% (male 317,526; female 321,709) (2003 est.), 57.9% (male 383,236/female 391,478) (2010 est.)
65 years and over: 2% (male 11,357; female 16,289) (2000 est.), 3.5% (male 18,040; female 23,041) (2003 est.), 3.5% (male 19,857/female 26,994) (2010 est.)
Median age
total: 18.5 years male: 18.2 years female: 18.8 years (2002)
Population growth rate
1.307% (2010 est.)
Birth rate
28.09 births/1,000 population (2010 est.)
Death rate
15.03 deaths/1,000 population (2010 est.)
Net migration rate
NA migrant(s)/1,000 population (2010 est.)
Sex ratio
at birth: 1.02 male(s)/female (2003 est.), 1.03 male(s)/female (2000 est.) under 15 years: 0.99 male(s)/female (2003, 2000 est.) 15-64 years: 0.99 (2003 est.), 0.93 male(s)/female (2000 est.) 65 years and over: 0.78 (2003 est.), 0.7 male(s)/female (2000 est.) total population: 0.99 (2003 est.), 0.95 male(s)/female (2000 est.)
Infant mortality rate
69.74 deaths/1,000 live births
Life expectancy at birth
total population: 47.85 years (2010 est.) 33.22 (2005 est.) 39.47 (2003 est.)
Total fertility rate
3.19 children born/woman (2010 est.)[1] 3.32 children born/woman (2009 est.) 3.92 children born/woman (2003 est.) 5.87 children born/woman (2000 est.)
HIV/AIDS - adult prevalence rate
26.1% (2007 est.) [3]
HIV/AIDS - people living with HIV/AIDS
190,000 (2007 est.) [3]
HIV/AIDS - deaths
10,000 (2007 est.)[1]
Nationality
noun: Swazi(s) adjective: Swazi
Ethnic groups
Religions
Christianity 57%, Zionist (a blend of Christianity and indigenous ancestral worship) 40%, other faiths (Muslim, Bahá'í) 3% (see Religion in Swaziland)
Languages
English (official, government business conducted in English), siSwati (official)
Literacy
definition: age 15 and over can read and write total population: 81.6% (2003 est.), 76.7% (1995 est.) male: 82.6% (2003 est.), 78% (1995 est.) female: 80.8% (2003 est.), 75.6% (1995 est.)
Notes
- ^ a b c The World Factbook: Swaziland, CIA, https://www.cia.gov/library/publications/the-world-factbook/geos/wz.html
- ^ http://www.theglobeandmail.com/servlet/story/LAC.20071222.SWAZII22/TPStory/TPInternational/Africa/
- ^ a b Swaziland statistics: HIV prevalence rate 2007 ages 15-49, UNICEF, http://www.unicef.org/infobycountry/swaziland_statistics.html
 Swaziland topics
Politics and government History Geography and ecology Economy and infrastructure Airports · Central Bank · Child labour · Communications · Companies · Swaziland Stock Exchange · TransportCulture and society Demographics · Languages · Music · Religion (Islam · Roman Catholicism) · Schools · University of SwazilandList of Swaziland-related articles Demographics of Africa Sovereign
states- Algeria
- Angola
- Benin
- Botswana
- Burkina Faso
- Burundi
- Cameroon
- Cape Verde
- Central African Republic
- Chad
- Comoros
- Democratic Republic of the Congo
- Republic of the Congo
- Côte d'Ivoire (Ivory Coast)
- Djibouti
- Egypt
- Equatorial Guinea
- Eritrea
- Ethiopia
- Gabon
- The Gambia
- Ghana
- Guinea
- Guinea-Bissau
- Kenya
- Lesotho
- Liberia
- Libya
- Madagascar
- Malawi
- Mali
- Mauritania
- Mauritius
- Morocco
- Mozambique
- Namibia
- Niger
- Nigeria
- Rwanda
- São Tomé and Príncipe
- Senegal
- Seychelles
- Sierra Leone
- Somalia
- South Africa
- South Sudan
- Sudan
- Swaziland
- Tanzania
- Togo
- Tunisia
- Uganda
- Zambia
- Zimbabwe
States with limited
recognition- Sahrawi Arab Democratic Republic
- Somaliland
Dependencies and
other territories- Canary Islands / Ceuta / Melilla / Plazas de soberanía (Spain)
- Madeira (Portugal)
- Mayotte / Réunion (France)
- Saint Helena / Ascension Island / Tristan da Cunha (United Kingdom)
- Western Sahara
Categories:- Demographics by country
- Swazi society
Wikimedia Foundation. 2010.