- Demographics of Zambia
-
This article is about the demographic features of the population of Zambia, including population density, ethnicity, education level, health of the populace, economic status, religious affiliations and other aspects of the population.
Zambia's population comprises more than 70 Bantu-speaking ethnic groups. Some ethnic groups are small, and only two have enough people to constitute at least 10% of the population. The majority of Zambians are subsistence farmers, but the country is also fairly urbanised, with 42% of the population being city residents. The predominant religion is a blend of traditional beliefs and Christianity.
Expatriates, mostly British or South African, as well as some white Zambian citizens (about 120,000), live mainly in Lusaka and in the Copperbelt in northern Zambia, where they are either employed in mines, financial and related activities or retired. Zambia also has a small but economically important Asian population, most of whom are Indian Muslims.
CIA World Factbook demographic statistics
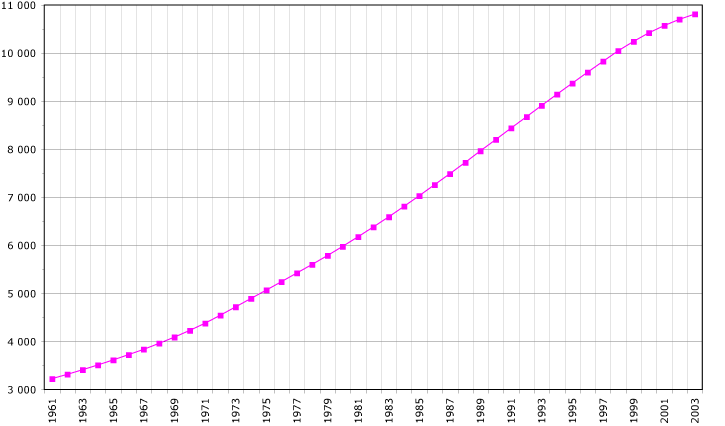
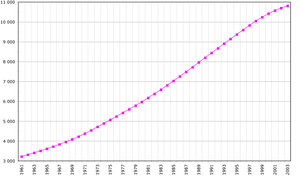 Demographics of Zambia, Data of FAO, year 2005 ; Number of inhabitants in thousands.
The following demographic statistics are from the CIA World Factbook, unless otherwise indicated.
Population
Year Population
(July est.)Growth rate
(est.)2010 12,056,923 +1.64% 2009 11,862,740 +1.66% 2008 11,669,534 +1.67% 2007 11,477,447 -0.21% 2006 11,502,010 +2.13% 2005 11,261,795 +7.64% 2004 10,462,436 +1.51% 2003 10,307,333 N/A 2000 9,582,418 N/A - note: estimates for this country explicitly take into account the effects of excess mortality due to AIDS; this can result in lower life expectancy, higher infant mortality and death rates, lower population and growth rates, and changes in the distribution of population by age and sex than would otherwise be expected.
Source: CIA Factbooks 2000-2010.
Birth / Death / Net Migration Rates
Year Birth rate (est.):
births/1000 pop.Death rate (est.):
deaths/1000 pop.Net migration rate (est.):
migrants/1000 pop.2010 39.93 21.15 -2.61 2009 40.24 21.34 -2.5 2008 40.52 21.35 -2.63 2007 40.78 21.46 -2.68 2006 41 19.93 0 2005 41.38 20.23 0 2004 38.99 24.35 0 2003 39.53 24.3 N/A 2000 41.9 22.08 -0.33 Source: CIA Factbooks 2000–2010.
Age structure
Year 0–14 years:
(male)0–14 years:
(female)0–14 years:
(% total)15–64 years
(male):15–64 years
(female):15–64 years
(% total):65 years & over
(male):65 years & over
(female):65 years & over
(% total):2010 2,710,947 2,685,181 44.8% 3,199,685 3,180,292 52.9% 113,299 167,519 2.3% 2009 2,685,142 2,659,771 45.1 3,122,305 3,116,846 52.6% 114,477 164,199 2.3% 2008 2,659,572 2,634,379 45.4% 3,045,536 3,053,465 52.3% 115,662 160,920 2.4% 2007 2,633,578 2,608,714 45.7% 2,969,913 2,990,923 51.9% 116,818 157,501 2.4% 2006 2,673,891 2,656,268 46.3% 2,925,910 2,969,324 51.3% 117,877 158,740 2.4% 2005 2,626,911 2,609,857 46.5% 2,848,402 2,904,376 51.1% 118,043 154,206 2.4% 2004 2,419,361 2,401,538 46.1% 2,684,001 2,667,528 51.1% 132,166 157,842 2.8% 2003 2,396,313 2,378,567 46.3% 2,626,961 2,621,818 50.9% 131,196 152,478 2.8% 2000 2,290,559 2,270,945 48% 2,369,317 2,413,070 50% 105,443 133,084 2% Median age
- total: 17.2 years
- male: 17.1 years
- female: 17.3 years (2010 est.)
- total: 16.46 years
- male: 16.26 years
- female: 16.67 years (2005 est.)
- total: 16.5 years
- male: 16.4 years
- female: 16.6 years (2002)
Sex ratio
- at birth: 1.03 male(s)/female
- under 15 years: 1.01 male(s)/female
- 15-64 years: 1.01 male(s)/female
- 65 years and over: 0.68 male(s)/female
- total population: 1 male(s)/female (2010 est.)
- at birth: 1.03 male(s)/female
- under 15 years: 1.01 male(s)/female
- 15-64 years: 0.98 male(s)/female
- 65 years and over: 0.76 male(s)/female
- total population: 0.99 male(s)/female (2005 est.)
- at birth: 1.03 male(s)/female
- under 15 years: 1.01 male(s)/female
- 15-64 years: 1 male(s)/female
- 65 years and over: 0.86 male(s)/female
- total population: 1 male(s)/female (2003 est.)
- at birth:1.03 male(s)/female
- under 15 years:1.01 male(s)/female
- 15-64 years:0.98 male(s)/female
- 65 years and over:0.79 male(s)/female
- total population:0.99 male(s)/female (2000 est.)
Infant mortality rate
- total: 99.92 deaths/1,000 live births
- male: 104.67 deaths/1,000 live births
- female: 95.04 deaths/1,000 live births (2010 est.)
- total: 88.29 deaths/1,000 live births
- male: 95.63 deaths/1,000 live births
- female: 80.72 deaths/1,000 live births (2005 est.)
- total: 99.29 deaths/1,000 live births
- female: 91.77 deaths/1,000 live births
- male: 106.58 deaths/1,000 live births (2003 est.)
- total 92.38 deaths/1,000 live births (2000 est.)
Life expectancy at birth
- total population: 52.03 years
- male: 50.81 years
- female: 53.28 years (2010 est.)
- total population: 39.7 years
- male: 39.43 years
- female: 39.98 years (2005 est.)
- total population: 35.25 years
- male: 35.25 years
- female: 35.25 years (2003 est.)
- total population:37.24 years
- male:37.08 years
- female:37.41 years (2000 est.)
Total fertility rate
- 5.07 children born/woman (2010 est.)
HIV/AIDS - adult prevalence rate
- 15.2% (2007 est.)
- 16.5% (2003 est.)
- 21.5% (2001 est.)
HIV/AIDS - people living with HIV/AIDS
- 1.1 million (2007 est.)
- 920,000 (2003 est.)
- 1.2 million (2001 est.)
HIV/AIDS - deaths
- 56,000 (2007 est.)
- 89,000 (2003 est.)
- 120,000 (2001 est.)
Nationality
- noun:Zambian(s)
- adjective:Zambian
Ethnic groups
African: 95% (includes Bemba, Tonga, Chewa, Lozi, Nsenga, Tumbuka, Ngoni, Lala, Kaonde, Lunda, and other African groups)
Other: 5% (includes Europeans, Asians, and Americans)(2000 Census)
Religions
- Christian 87%, Muslim and Hindu 1%, indigenous beliefs and other 12%[1]
Languages
- English (official), major vernaculars - Bemba, Kaonde, Lozi, Lunda, Luvale, Nyanja, Tonga, and about 70 other indigenous languages (Ambo - Aushi - Bisa - Chikunda - Cishinga - Chokwe - Gova - Ila - Inamwanga - Iwa - Kabende - Kosa - Kunda - Kwandi - Kwandu - Kwangwa - Lala - Lamba - Lenje - Leya - Lima - Liyuwa - Luano - Lucazi - Lumbu - Lundwe - Lungu - Lunda - Makoma - Mambwe - Mashasha - Mashi - Mbowe - Mbukushu - Mbumi - Mbunda - Mbwela - Mukulu - Mulonga - Ndembu - Ng'umbo - Nkoya - Nsenga - Nyengo - Nyiha - Sala - Seba - Senga - Shanjo - Shila - Simaa - Soli - Subiya - Swaka - Tabwa - Tambo - Toka - Totela - Tumbuka - Twa - Unga - Wandya - Yombe)
Literacy
definition: age 15 and over can read and write English
- total population: 80.6%
- male: 86.8%
- female: 74.8% (2003 est.)
- total population: 78.2%
- male: 85.6%
- female: 71.3% (1995 est.)
References
See also
Demographics of Africa Sovereign
states- Algeria
- Angola
- Benin
- Botswana
- Burkina Faso
- Burundi
- Cameroon
- Cape Verde
- Central African Republic
- Chad
- Comoros
- Democratic Republic of the Congo
- Republic of the Congo
- Côte d'Ivoire (Ivory Coast)
- Djibouti
- Egypt
- Equatorial Guinea
- Eritrea
- Ethiopia
- Gabon
- The Gambia
- Ghana
- Guinea
- Guinea-Bissau
- Kenya
- Lesotho
- Liberia
- Libya
- Madagascar
- Malawi
- Mali
- Mauritania
- Mauritius
- Morocco
- Mozambique
- Namibia
- Niger
- Nigeria
- Rwanda
- São Tomé and Príncipe
- Senegal
- Seychelles
- Sierra Leone
- Somalia
- South Africa
- South Sudan
- Sudan
- Swaziland
- Tanzania
- Togo
- Tunisia
- Uganda
- Zambia
- Zimbabwe
States with limited
recognition- Sahrawi Arab Democratic Republic
- Somaliland
Dependencies and
other territories- Canary Islands / Ceuta / Melilla / Plazas de soberanía (Spain)
- Madeira (Portugal)
- Mayotte / Réunion (France)
- Saint Helena / Ascension Island / Tristan da Cunha (United Kingdom)
- Western Sahara
Categories:- Demographics of Zambia
- Ethnic groups in Zambia
Wikimedia Foundation. 2010.