- Quantitative trait locus
-
See also: Epistasis
Quantitative traits refer to phenotypes (characteristics) that vary in degree and can be attributed to polygenic effects, i.e., product of two or more genes, and their environment. Quantitative trait loci (QTLs) are stretches of DNA containing or linked to the genes that underlie a quantitative trait. Mapping regions of the genome that contain genes involved in specifying a quantitative trait is done using molecular tags such as AFLP or, more commonly SNPs . This is an early step in identifying and sequencing the actual genes underlying trait variation.
Contents
Quantitative traits
Polygenic inheritance, also known as quantitative or multifactorial inheritance refers to inheritance of a phenotypic characteristic (trait) that is attributable to two or more genes, or the interaction with the environment, or both. Unlike monogenic traits, polygenic traits do not follow patterns of Mendelian inheritance (separated traits). Instead, their phenotypes typically vary along a continuous gradient depicted by a bell curve.[1]
An example of a polygenic trait is human skin color. Many genes factor into determining a person's natural skin color, so modifying only one of those genes changes the color only slightly. Many disorders with genetic components are polygenic, including autism, cancer, diabetes and numerous others. Most phenotypic characteristics are the result of the interaction of multiple genes.
Examples of disease processes generally considered to be results of multifactorial etiology:
Congenital malformation
- Cleft palate[2][3]
- Congenital dislocation of the hip[4]
- Congenital heart defects
- Neural tube defects
- Pyloric stenosis
- Talipes
Adult onset diseases
- Diabetes Mellitus[3]
- Cancer[3]
- Epilepsy
- Glaucoma
- Hypertension
- Ischaemic heart disease
- Manic depression
- Schizophrenia
- Psoriasis
- Thyroid diseases
Multifactorially inherited diseases are said to constitute the majority of genetic disorders affecting humans which will result in hospitalization or special care of some kind.[5][6]
Multifactorial traits in general
Generally, multifactorial traits outside of illness contribute to what we see as continuous characteristics in organisms, such as height,[5] skin color, and body mass.[7] All of these phenotypes are complicated by a great deal of interplay between genes and environment.[5] The continuous distribution of traits such as height and skin colour described above reflects the action of genes that do not quite show typical patterns of dominance and recessiveness. Instead the contributions of each involved locus are thought to be additive. Writers have distinguished this kind of inheritance as polygenic, or quantitative inheritance.[8]
Thus, due to the nature of polygenic traits, inheritance will not follow the same pattern as a simple monohybrid or dihybrid cross.[6] Polygenic inheritance can be explained as Mendelian inheritance at many loci,[5] resulting in a trait which is normally-distributed. If n is the number of involved loci, then the coefficients of the binomial expansion of (a + b)2n will give the frequency of distribution of all n allele combinations. For a sufficiently high n, this binomial distribution will begin to resemble a normal distribution. From this viewpoint, a disease state will become apparent at one of the tails of the distribution, past some threshold value. Disease states of increasing severity will be expected the further one goes past the threshold and away from the mean.[8]
Heritable disease and multifactorial inheritance
A mutation resulting in a disease state is often recessive, so both alleles must be mutant in order for the disease to be expressed phenotypically. A disease or syndrome may also be the result of the expression of mutant alleles at more than one locus. When more than one gene is involved with or without the presence of environmental triggers, we say that the disease is the result of multifactorial inheritance.
The more genes involved in the cross, the more the distribution of the genotypes will resemble a normal, or Gaussian distribution.[5] This shows that multifactorial inheritance is polygenic, and genetic frequencies can be predicted by way of a polyhybrid Mendelian cross. Phenotypic frequencies are a different matter, especially if they are complicated by environmental factors.
The paradigm of polygenic inheritance as being used to define multifactorial disease has encountered much disagreement. Turnpenny (2004) discusses how simple polygenic inheritance cannot explain some diseases such as the onset of Type I diabetes mellitus, and that in cases such as these, not all genes are thought to make an equal contribution.[8]
The assumption of polygenic inheritance is that all involved loci make an equal contribution to the symptoms of the disease. This should result in a normal curve distribution of genotypes. When it does not, the idea of polygenetic inheritance cannot be supported for that illness.
A cursory look at some examples
Examples of such diseases are not new to medicine. The above examples are well-known examples of diseases having both genetic and environmental components. Other examples involve atopic diseases such as eczema or dermatitis;[5] also spina bifida (open spine) and anencephaly (open skull) are other examples[2]
While schizophrenia is widely believed to be multifactorially genetic by biopsychiatrists, no characteristic genetic markers have been determined with any certainty.
Is it multifactorially heritable?
It is difficult to ascertain if any particular disease is multifactorially genetic. If a pedigree chart is taken of the patient's family and relations, and it is shown that the brothers and sisters of the patient have the disease, then there is a strong chance that the disease is genetic and that the patient will also be a genetic carrier. But this is not quite enough. It also needs to be proven that the pattern of inheritance is non-Mendelian. This would require studying dozens, even hundreds of different family pedigrees before a conclusion of multifactorial inheritance is drawn. This often takes several years.
If multifactorial inheritance is indeed the case, then the chance of the patient contracting the disease is reduced if only cousins and more distant relatives have the disease.[2] It must be stated that while multifactorially-inherited diseases tend to run in families, inheritance will not follow the same pattern as a simple monohybrid or dihybrid cross.[6]
If a genetic cause is suspected and little else is known about the illness, then it remains to be seen exactly how many genes are involved in the phenotypic expression of the disease. Once that is determined, the question must be answered: if two people have the required genes, why are there differences in expression between them? Generally, what makes the two individuals different are likely to be environmental factors. Due to the involved nature of genetic investigations needed to determine such inheritance patterns, this is not usually the first avenue of investigation one would choose to determine etiology.
Quantitative trait locus
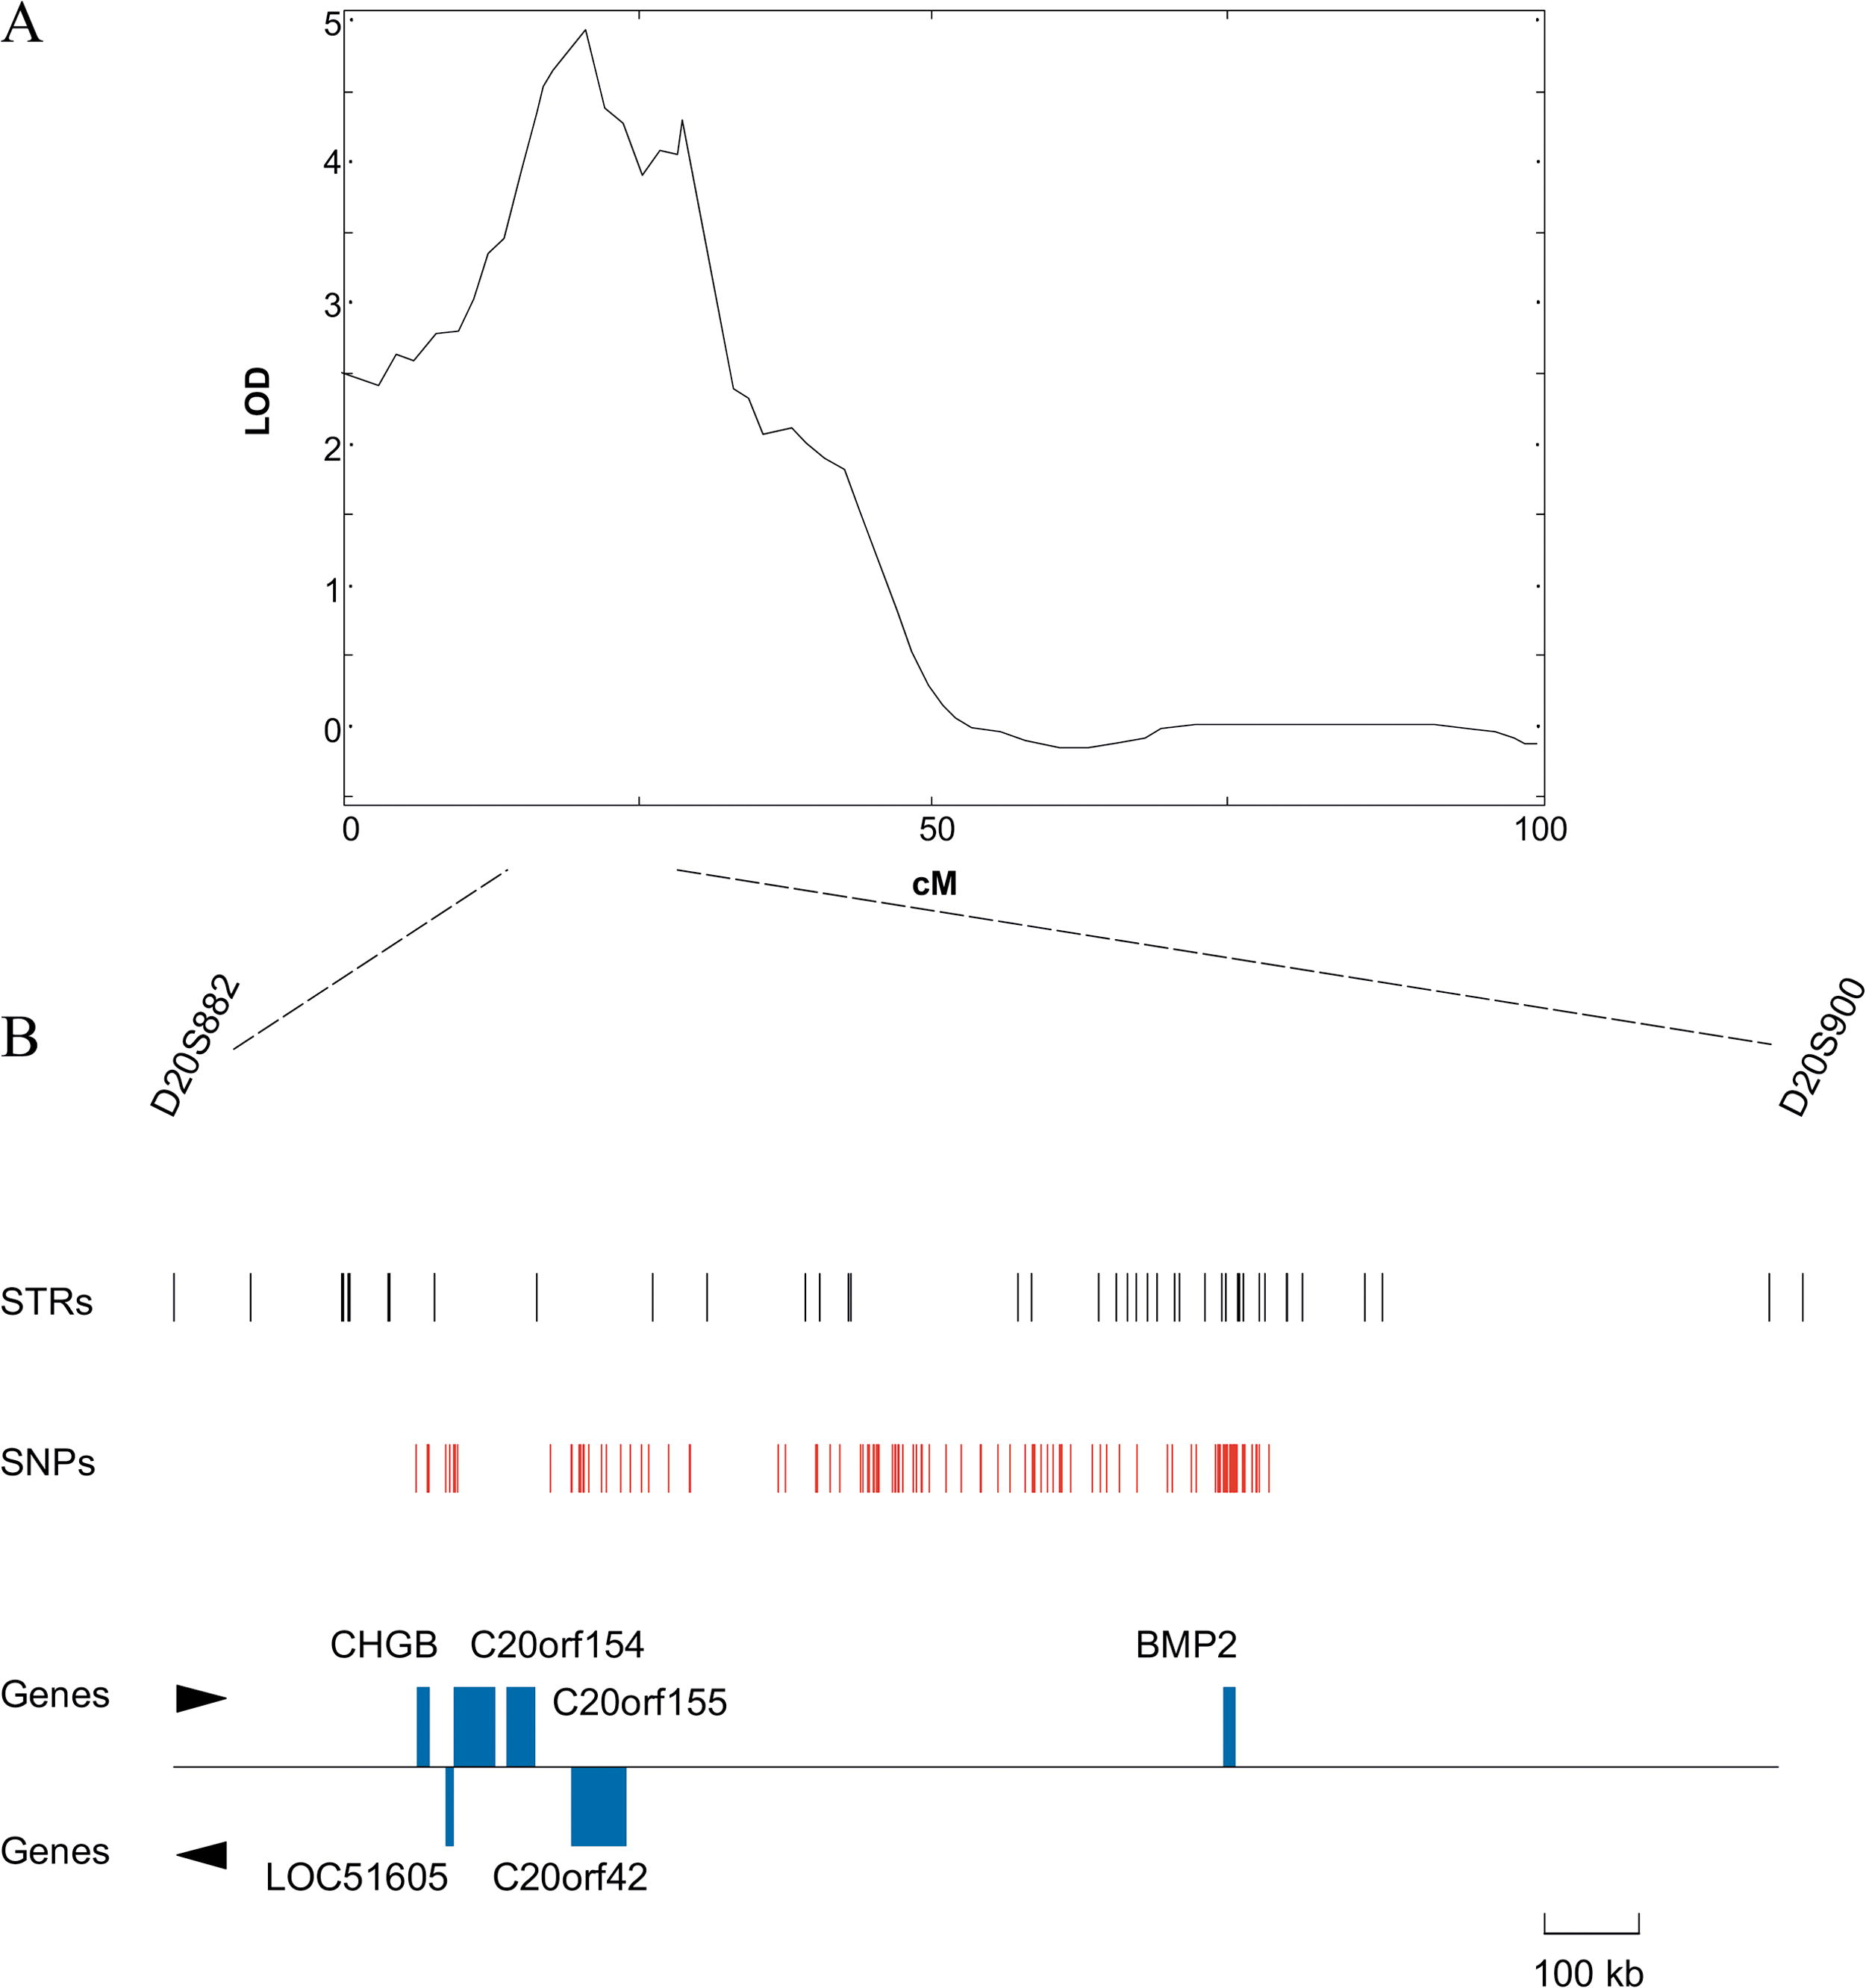
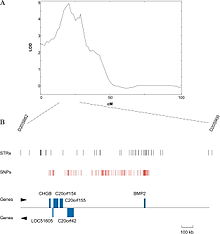 A QTL for osteoporosis on the human chromosome 20
Typically, QTLs underlie continuous traits (those traits that vary continuously, e.g. height) as opposed to discrete traits (traits that have two or several character values, e.g. red hair in humans, a recessive trait, or smooth vs. wrinkled peas used by Mendel in his experiments).
Moreover, a single phenotypic trait is usually determined by many genes. Consequently, many QTLs are associated with a single trait.
A quantitative trait locus (QTL) is a region of DNA that is associated with a particular phenotypic trait - these QTLs are often found on different chromosomes. Knowing the number of QTLs that explains variation in the phenotypic trait tells us about the genetic architecture of a trait. It may tell us that plant height is controlled by many genes of small effect, or by a few genes of large effect.
Another use of QTLs is to identify candidate genes underlying a trait. Once a region of DNA is identified as contributing to a phenotype, it can be sequenced. The DNA sequence of any genes in this region can then be compared to a database of DNA for genes whose function is already known.
In a recent development, classical QTL analyses are combined with gene expression profiling i.e. by DNA microarrays. Such expression QTLs (eQTLs) describe cis- and trans-controlling elements for the expression of often disease-associated genes. Observed epistatic effects have been found beneficial to identify the gene responsible by a cross-validation of genes within the interacting loci with metabolic pathway- and scientific literature databases.
QTL mapping
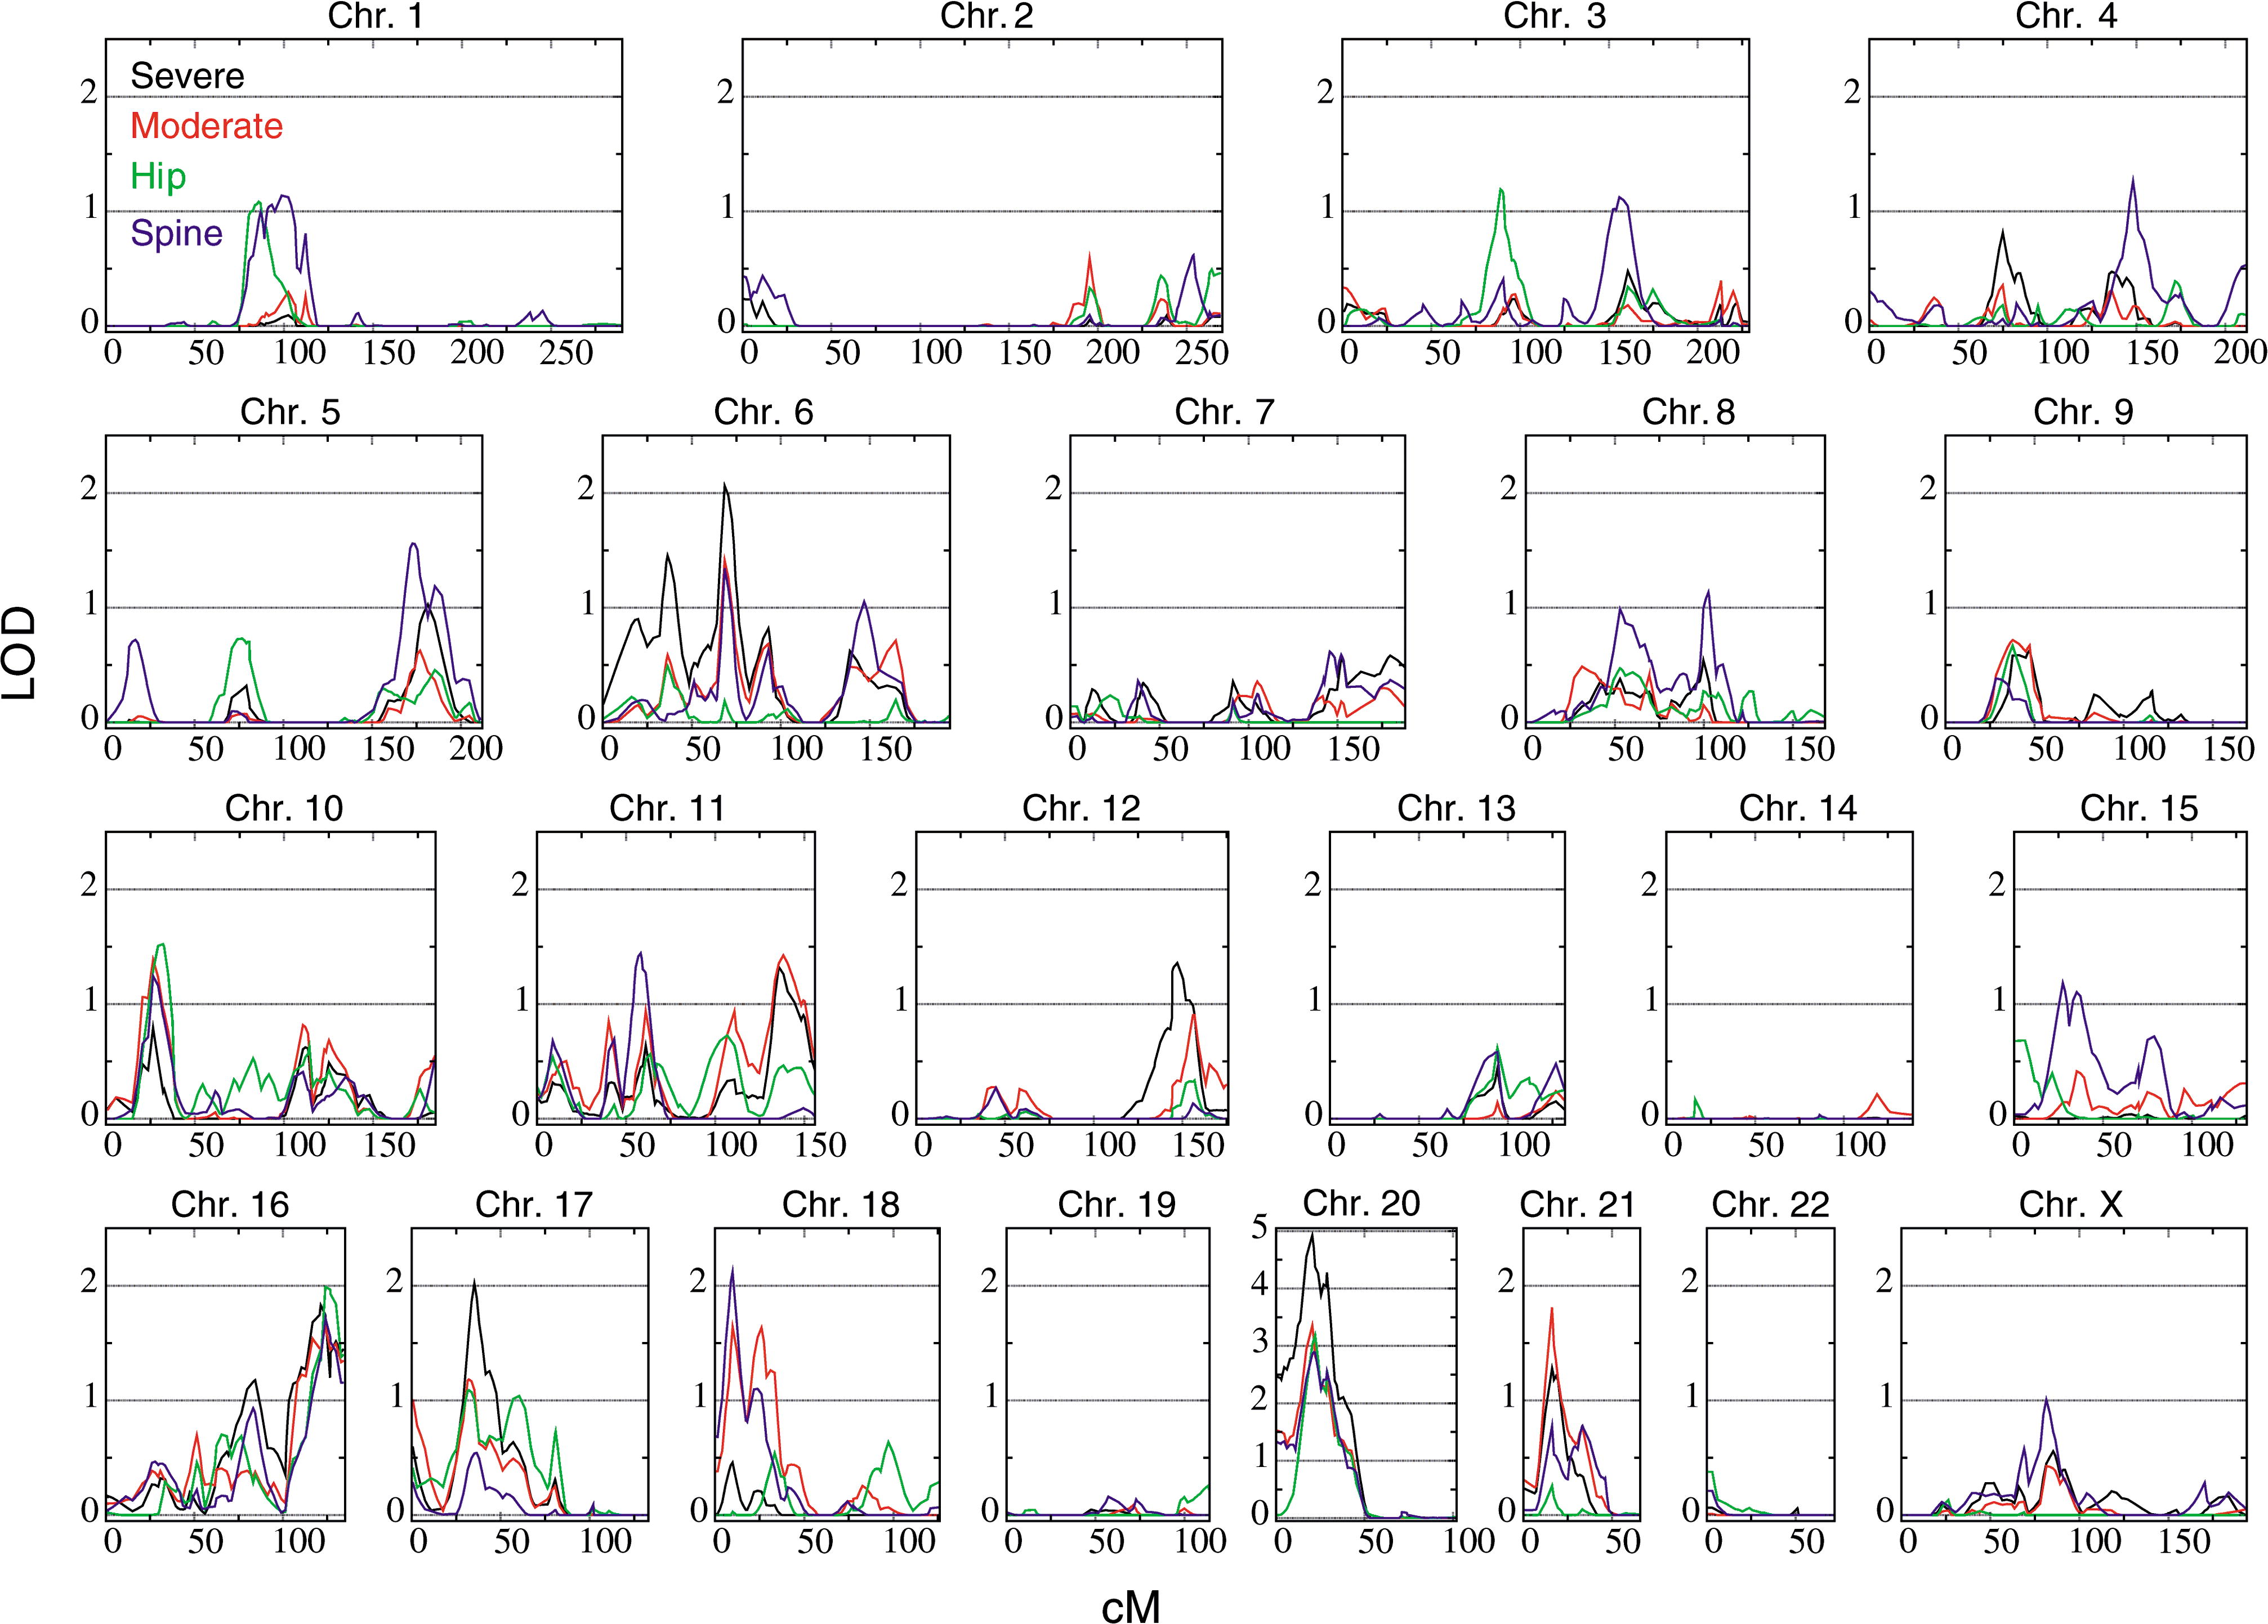
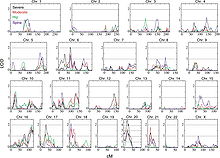 Example of a genome-wide scan for QTL of osteoporosis
QTL mapping is the statistical study of the alleles that occur at a locus and the phenotypes (physical forms or traits) that they produce. Because most traits of interest are governed by more than one gene, defining and studying the entire locus of genes related to a trait gives hope of understanding what effect the genotype of an individual might have in the real world.
Statistical analysis is required to demonstrate that different genes interact with one another and to determine whether they produce a significant effect on the phenotype. QTLs identify a particular region of the genome as containing a gene that is associated with the trait being assayed or measured. They are shown as intervals across a chromosome, where the probability of association is plotted for each marker used in the mapping experiment.
The QTL techniques were developed in the late 1980s and can be performed on inbred strains of any species.
To begin, a set of genetic markers must be developed for the species in question. A marker is an identifiable region of variable DNA. Biologists are interested in understanding the genetic basis of phenotypes (physical traits). The aim is to find a marker that is significantly more likely to co-occur with the trait than expected by chance, that is, a marker that has a statistical association with the trait. Ideally, they would be able to find the specific gene or genes in question, but this is a long and difficult undertaking. Instead, they can more readily find regions of DNA that are very close to the genes in question. When a QTL is found, it is often not the actual gene underlying the phenotypic trait, but rather a region of DNA that is closely linked with the gene.
For organisms whose genomes are known, one might now try to exclude genes in the identified region whose function is known with some certainty not to be connected with the trait in question. If the genome is not available, it may be an option to sequence the identified region and determine the putative functions of genes by their similarity to genes with known function, usually in other genomes. This can be done using BLAST, an online tool that allows users to enter a primary sequence and search for similar sequences within the BLAST database of genes from various organisms.
Another interest of statistical geneticists using QTL mapping is to determine the complexity of the genetic architecture underlying a phenotypic trait. For example, they may be interested in knowing whether a phenotype is shaped by many independent loci, or by a few loci, and do those loci interact. This can provide information on how the phenotype may be evolving.
Analysis of variance
The simplest method for QTL mapping is analysis of variance (ANOVA, sometimes called "marker regression") at the marker loci. In this method, in a backcross, one may calculate a t-statistic to compare the averages of the two marker genotype groups. For other types of crosses (such as the intercross), where there are more than two possible genotypes, one uses a more general form of ANOVA, which provides a so-called F-statistic. The ANOVA approach for QTL mapping has three important weaknesses. First, we do not receive separate estimates of QTL location and QTL effect. QTL location is indicated only by looking at which markers give the greatest differences between genotype group averages, and the apparent QTL effect at a marker will be smaller than the true QTL effect as a result of recombination between the marker and the QTL. Second, we must discard individuals whose genotypes are missing at the marker. Third, when the markers are widely spaced, the QTL may be quite far from all markers, and so the power for QTL detection will decrease.
Interval mapping
Lander and Botstein developed interval mapping, which overcomes the three disadvantages of analysis of variance at marker loci. Interval mapping is currently the most popular approach for QTL mapping in experimental crosses. The method makes use of a genetic map of the typed markers, and, like analysis of variance, assumes the presence of a single QTL. Each location in the genome is posited, one at a time, as the location of the putative QTL....
Composite interval mapping (CIM)
In this method, one performs interval mapping using a subset of marker loci as covariates. These markers serve as proxies for other QTLs to increase the resolution of interval mapping, by accounting for linked QTLs and reducing the residual variation. The key problem with CIM concerns the choice of suitable marker loci to serve as covariates; once these have been chosen, CIM turns the model selection problem into a single-dimensional scan. The choice of marker covariates has not been solved, however. Not surprisingly, the appropriate markers are those closest to the true QTLs, and so if one could find these, the QTL mapping problem would be complete anyway.
Family-pedigree based mapping in plants
Plant geneticists are attempting to incorporate some of the methods pioneered in human genetics.[9] Using family-pedigree based approach has been discussed (Bink et al. 2008). Family-based linkage and association has been successfully implemented (Rosyara et al. 2009)[10]
See also
- Epistasis
- Dominance (genetics)
- Expression quantitative trait loci (eQTL)
- Association Mapping
- Nested Association Mapping
References
- ^ Ricki Lewis (2003), Multifactorial Traits, McGraw-Hill Higher Education, http://highered.mcgraw-hill.com/sites/007246268x/student_view0/chapter7/.
- ^ a b c "Medical Genetics: Multifactorial Inheritance". Children's Hospital of the King's Daughters. 31 December 2005. http://www.chkd.org/HealthLibrary/Content.aspx?pageid=P02134. Retrieved 2007-01-06.
- ^ a b c "Multifactorial Inheritance". Pregnancy and Newborn Health Education Centre. The March of Dimes. http://www.marchofdimes.com/pnhec/4439_4138.asp. Retrieved 2007-01-06.
- ^ Emery's Elements of Medical Genetics
- ^ a b c d e f Tissot, Robert. "Human Genetics for 1st Year Students: Multifactorial Inheritance". http://www.uic.edu/classes/bms/bms655/lesson11.html. Retrieved 2007-01-06.
- ^ a b c "Multifactorial Inheritance". Clinical Genetics: A Self-Study Guide for Health Care Providers. University of South Dakota School of Medicine. Archived from the original on 2006-12-30. http://web.archive.org/web/20061230084542/http://www.usd.edu/med/som/genetics/curriculum/1GMULTI5.htm. Retrieved 2007-01-06.
- ^ "Definition of Multifactorial inheritance". MedicineNet.com MedTerms Dictionary. MedicineNet.com. http://www.medterms.com/script/main/art.asp?articlekey=4453. Retrieved 2007-01-06.
- ^ a b c Turnpenny, Peter (2004). "Emery's Elements of Medical Genetics, 12th Edition, Chapter 9" (PDF). Elsevier. http://www.fleshandbones.com/readingroom/viewchapter.cfm?ID=1041. Retrieved 2007-01-06.
- ^ Jannink, J; Bink, Mc; Jansen, Rc (Aug 2001). "Using complex plant pedigrees to map valuable genes". Trends in plant science 6 (8): 337–42. doi:10.1016/S1360-1385(01)02017-9. ISSN 1360-1385. PMID 11495765.
- ^ Rosyara, U. R.; Maxson-stein, K.L.; Glover, K.D.; Stein, J.M.; Gonzalez-hernandez, J.L. (2007). "Family-based mapping of FHB resistance QTLs in hexaploid wheat". Proceedings of National Fusarium head blight forum
- Bink MCAM, Boer MP, ter Braak CJF, Jansen J, Voorrips RE, van de Weg WE: Bayesian analysis of complex traits in pedigreed plant populations.
Euphytica 2008 , 161:85-96.
External links
- Precision Mapping of Quantitative Trait Loci
- QTL Cartographer
- Complex Trait Consortium
- A Statistical Framework for Quantitative Trait Mapping
- WebQTL
- GridQTL
- QTL discussion forum
- A list of computer programs for genetic analysis including QTL analysis
Genetics: Quantitative genetics Concepts in Quantitative Genetics 
Related Topics Categories:- Classical genetics
- Genetics
- Statistical genetics
Wikimedia Foundation. 2010.