- North West Norfolk (UK Parliament constituency)
-
North West Norfolk County constituency for the House of Commons 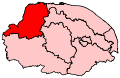
Boundary of North West Norfolk in Norfolk.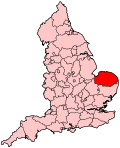
Location of Norfolk within England.County Norfolk Electorate 73,269 (December 2010)[1] Current constituency Created 1974 Member of Parliament Henry Bellingham (Conservative) Number of members One Created from King's Lynn 1885–1918 Number of members One Replaced by King's Lynn Overlaps European Parliament constituency East of England North West Norfolk is a county constituency represented in the House of Commons of the Parliament of the United Kingdom. It elects one Member of Parliament (MP) by the first past the post voting system.
Contents
History
The constituency was created under the Redistribution of Seats Act 1885 for the 1885 general election, and abolished for the 1918 general election. It was re-established for the February 1974 general election, replacing the former King's Lynn constituency.
The Conservatives won the seat on its recreation in 1974, though in March 1981 the sitting Conservative MP, Christopher Brocklebank-Fowler, became the only Conservative MP to defect to the newly formed Social Democratic Party. Brocklebank-Fowler lost his seat to the new Conservative candidate Henry Bellingham at the 1983 general election. Bellingham increased his lead over Brocklebank-Fowler at the 1987 general election. Brocklebank-Fowler chose to contest the South Norfolk constituency instead at the 1992 general election and Labour regained second place, almost doubling their share of the vote. Labour gained the seat at the 1997 general election but Bellingham regained the seat at the 2001 general election and increased his majority subsequently in both 2005 and 2010.
The latter election provoked controversy when the Labour candidate for North West Norfolk, Manish Sood, a Leicester councillor,[2] stated in an interview with the local newspaper Lynn News that Gordon Brown was "the worst prime minister we have had in this country", which gained national attention and resulted in Labour disowning their candidate. Sood did not attend the count and stated he would watch it from his home in Leicester.[3] He finished third, behind Bellingham and the Liberal Democrat candidate William Summers, whose party received their best ever result in the constituency,[4] with an 18.3% swing against Labour.[5][6][7]
Boundaries
For the general elections from 1997 to 2005 North West Norfolk consisted of 30 wards from the district of King's Lynn and West Norfolk. The boundary changes which took effect for the 2010 general election transferred four wards in the areas of Walton, Marshland St. James, Tilney St Lawrence, and Wiggenhall to the South West Norfolk constituency creating a smaller North West Norfolk constituency.
Constituency profile
Norfolk North West constituency covers an extensive hinterland in the far corner of East Anglia - remote from East London and Essex, but close to Lincolnshire and the East Midlands, with which the area arguably has more in common.
King's Lynn is a town with its fair share of poverty and social problems in some quarters - within the relatively affluent East Anglia region, only Jaywick and Great Yarmouth tend to score higher in deprivation indices.
Also in the constituency is the tourist resort of Hunstanton and the royal estate at Sandringham, along with many small villages and acres of farmland, all of which add up to a seat that should be safely Conservative in all but the very worst years for the party.
Labour's share of the vote has fallen from a winning 43.8% in the 1997 election to just 13.3% in 2010. No seat in the country has swung more heavily against Labour since they came to power.[citation needed]
Members of Parliament
MPs 1885-1918
Election Member [8] Party 1885 Joseph Arch Liberal 1886 Lord Henry Cavendish-Bentinck 1892 Joseph Arch Liberal 1900 Sir George White Liberal 1912 by-election Edward George Hemmerde Liberal 1918 constituency abolished: see King's Lynn MPs since 1974
Election Member [8] Party Feb. 1974 Christopher Brocklebank-Fowler Conservative 1981 SDP 1983 Henry Bellingham Conservative 1997 George Turner Labour 2001 Henry Bellingham Conservative Elections
Elections in the 2010s
General Election 2010: North West Norfolk[9] Party Candidate Votes % ±% Conservative Henry Bellingham 25,916 54.2 +4.3 Liberal Democrat William Summers 11,106 23.2 +8.5 Labour Manish Sood 6,353 13.3 -18.3 UKIP John William Gray 1,841 3.9 +0.2 BNP David Fleming 1,839 3.8 +3.8 Green Mike de Whalley 745 1.6 +1.6 Majority 14,810 31.0 Turnout 47,800 65.3 +3.7 Conservative hold Swing +11.3 Elections in the 2000s
General Election 2005: North West Norfolk Party Candidate Votes % ±% Conservative Henry Bellingham 25,471 50.3 +1.8 Labour Damien Welfare 16,291 32.2 -9.5 Liberal Democrat Simon Higginson 7,026 13.9 +5.5 UKIP Michael Stone 1,861 3.7 +2.3 Majority 9,180 18.1 +11.3 Turnout 50,649 61.6 -3.5 Conservative hold Swing +5.7 General Election 2001: North West Norfolk Party Candidate Votes % ±% Conservative Henry Bellingham 24,846 48.5 +7.0 Labour George Turner 21,361 41.7 -2.1 Liberal Democrat Ian Mack 4,292 8.4 -1.2 UKIP Ian Durrant 704 1.4 N/A Majority 3,485 6.8 Turnout 51,203 65.1 -9.7 Conservative gain from Labour Swing Elections in the 1990s
General Election 1997: North West Norfolk[10] Party Candidate Votes % ±% Labour George Turner 25,250 43.8 +10.2 Conservative Henry Bellingham 23,911 41.5 -10.6 Liberal Democrat E Knowles 5,513 9.6 -4.2 Referendum Party R Percival 2,923 5.1 N/A Majority 1,339 2.3 Turnout 74.7 -6.0 Labour gain from Conservative Swing 10.4 General Election 1992: North West Norfolk[11] Party Candidate Votes % ±% Conservative Henry Bellingham 32,554 52.1 +1.6 Labour George Turner 20,990 33.6 +16.1 Liberal Democrat AM Waterman 8,599 13.8 −18.2 Natural Law SRA Pink 330 0.5 N/A Majority 11,564 18.5 −0.1 Turnout 62,473 80.7 +1.8 Conservative hold Swing −7.3 See also
Notes and references
- ^ "Electorate Figures - Boundary Commission for England". 2011 Electorate Figures. Boundary Commission for England. 4 March 2011. http://www.boundarycommissionforengland.org.uk/electoral-figures/electoral-figures.htm. Retrieved 13 March 2011.
- ^ "Thousands celebrate Diwali event". BBC News. 28 October 2008. http://news.bbc.co.uk/2/hi/uk_news/england/leicestershire/7694682.stm. Retrieved 5 May 2010.
- ^ PM attack Labour candidate stayed at home [1] Diss Express 6th May 2010
- ^ Chris Bishop (8 May 2010). "Henry Bellingham increases his NW Norfolk majority". Norwich Evening News. http://www.eveningnews24.co.uk/content/eveningnews24/norwich-news/election-2010/election-local/story.aspx?brand=EDPOnline&category=Elec2010Local&tBrand=EDPOnline&tCategory=Elec2010Local&itemid=NOED07%20May%202010%2016%3A41%3A12%3A787.
- ^ "Election 2010: Brown worst PM says Labour candidate". BBC News. 2010-04-16. http://news.bbc.co.uk/1/hi/uk_politics/election_2010/8659399.stm. Retrieved 5 May 2010.
- ^ "Brown is 'worst PM ever'". BBC News. 2010-04-16. http://news.bbc.co.uk/2/hi/uk_news/politics/election_2010/8659440.stm. Retrieved 5 May 2010.
- ^ Mason, Trevor (4 May 2010). "Disowned candidate Manish Sood unrepentant over PM blast". The Independent. http://www.independent.co.uk/news/uk/politics/brown-worst-ever-pm-says-labour-candidate-1961848.html. Retrieved 5 May 2010.
- ^ a b Leigh Rayment's Historical List of MPs – Constituencies beginning with "N" (part 2)
- ^ http://ukpollingreport.co.uk/guide/seat-profiles/norfolknorthwest
- ^ Election results 1992-2005, Guardian
- ^ "Politics Resources". Election 1992. Politics Resources. 9 April 1992. http://www.politicsresources.net/area/uk/ge92/ge92index.htm. Retrieved 2010-12-06.
Categories:- Parliamentary constituencies in Norfolk
- United Kingdom Parliamentary constituencies established in 1885
- United Kingdom Parliamentary constituencies disestablished in 1918
- United Kingdom Parliamentary constituencies established in 1974


Wikimedia Foundation. 2010.