- South Norfolk (UK Parliament constituency)
-
This article is about South Norfolk Parliament constituency. For South Norfolk District Council, see South Norfolk.
South Norfolk County constituency for the House of Commons 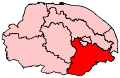
Boundary of South Norfolk in Norfolk.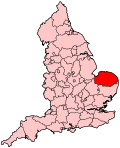
Location of Norfolk within England.County Norfolk Electorate 77,316 (December 2010)[1] Current constituency Created 1868 Member of Parliament Richard Bacon (Conservative) Number of members One (Two 1868-1885) Overlaps European Parliament constituency East of England South Norfolk is a county constituency represented in the House of Commons of the Parliament of the United Kingdom. From 1868 until 1885 it returned two members but thereafter elected one Member of Parliament (MP) by the first past the post system of election.
Contents
Boundaries and boundary changes
Following the Reform Act 1832 the historic county of Norfolk was split into two, two member, county divisions - East Norfolk and West Norfolk. The Reform Act 1867 provided for the county to be redistributed into three, two member, county divisions.
The three divisions, used for the United Kingdom general election, 1868 were this one, North Norfolk and West Norfolk.
The Southern division had its place of election (where the hustings stood, at which nominations were made, votes cast before the introduction of multiple polling districts in county constituencies and the result was declared) at Norwich. This was the same place of election as the former Eastern division. In 1868 the same two MPs who had sat for East Norfolk before the dissolution were re-elected from this constituency.
Under the provisions of the Redistribution of Seats Act 1885, single member constituencies became the norm. In Norfolk the three, two member, county divisions were changed to six single member seats. These were this constituency, a revived East Norfolk, Mid Norfolk, North Norfolk, North West Norfolk and South West Norfolk
In the 1885 redistribution this constituency bordered Mid Norfolk to the west, the borough constituency of Norwich and East Norfolk to the north, the borough of Great Yarmouth and the Suffolk constituency of Lowestoft to the east and another Suffolk division Eye to the south.
The Southern division was very agricultural in character. The largest town was Diss, which had a population of fewer than 4,000 people in 1900.
The then local government units, which comprised the constituency at redistributions from 1918, were as follows.
1918-1950: Diss Urban District and the Rural Districts of Depwade, Forehoe, Henstead, Wayland with part of Thetford.
1950-1974: The Municipal Borough of Thetford, the Urban Districts of Diss and Wymondham and the Rural Districts of Depwade, Loddon and Wayland; combined to produce a somewhat more urban constituency than before.
1974-1983: The constituency was unchanged except for the addition of Forehoe and Henstead Rural District. This was the last redistribution before a major reorganisation of local government, which amalgamated many of the smaller local authorities.
1983-1997: The whole of the territory of the new seat had been part of the previous version. It consisted of the entire District of South Norfolk. The other part of the old seat (the Thetford and Wayland areas) were transferred to the South West Norfolk constituency in the 1983 redistribution.
1997 redistribution: Continuing population growth led to a reduction in the size of the constituency. It now comprises all the wards of the District of South Norfolk except the Cringleford and Colney and New Costessey wards.
For the 2010 general election, the Boundary Commission for England reduced the part of the District of South Norfolk comprising the constituency. Eight wards became part of other seats. The following twenty eight wards remained in this constituency:
Beck Vale, Bressingham and Burston, Brooke, Bunwell, Chedgrave and Thurton, Cringleford, Dickleburgh, Diss, Ditchingham and Broome, Earsham, Easton, Forncett, Gillingham, Harleston, Hempnall, Hethersett, Loddon, Mulbarton, Newton Flotman, Old Costessey, Poringland with the Framinghams, Rockland, Roydon, Scole, Stoke Holy Cross, Stratton, Tasburgh, and Thurlton.
Members of Parliament
MPs 1868 – 1885 (two seats)
Election 1st Member[2] 1st Party 2nd Member[2] 2nd Party 1868 Clare Sewell Read Conservative Edward Howes Conservative 1871 Sir Robert Jacob Buxton, Bt Conservative 1880 Robert Thornhagh Gurdon Liberal 1885 representation reduced to one member MPs since 1885 (one seat)
Election Member[2] Party 1885 Francis Taylor Liberal 1886 Liberal Unionist 1898 Arthur Wellesley Soames Liberal 1918 Hon. William Cozens-Hardy a Liberal 1919 Coalition Liberal 1920 George Edwards Labour 1922 Thomas William Hay Conservative 1923 George Edwards Labour 1924 James Archibald Christie Conservative 1945 Christopher Mayhew Labour 1950 Peter Baker b Conservative 1955 by-election John Hill Conservative Feb 1974 John MacGregor Conservative 2001 Richard Bacon Conservative Notes:-
- a Cozens-Hardy stood at the United Kingdom general election, 1918 as a Liberal without the Coalition "coupon", but he took the Coalition Liberal whip when Parliament assembled in 1919.
- b Baker was expelled from the House of Commons in 1954 after being convicted of fraud, forgery and uttering and sentenced to seven years imprisonment.
Elections
Elections in the 2010s
General Election 2010: South Norfolk Party Candidate Votes % ±% Conservative Richard Bacon 27,133 49.3 +4.6 Liberal Democrat Jacky Howe 16,193 29.4 -0.4 Labour Mick Castle 7,252 13.2 -9.3 UKIP Evan Heasley 2,329 4.2 +1.4 BNP Helen Mitchell 1,086 2.0 +2.0 Green Jo Willcott 1,000 1.8 +1.8 Majority 10,940 19.9 Turnout 54,993 72.2 +3.1 Conservative hold Swing +3.3 Elections in the 2000s
General Election 2005: South Norfolk Party Candidate Votes % ±% Conservative Richard Bacon 26,399 44.8 +2.6 Liberal Democrat Ian Mack 17,617 29.9 +0.0 Labour John Morgan 13,262 22.5 -2.0 UKIP Philip Tye 1,696 2.9 +1.4 Majority 8,782 14.9 Turnout 58,974 68.7 +1.1 Conservative hold Swing 1.3 General Election 2001: South Norfolk Party Candidate Votes % ±% Conservative Richard Bacon 23,589 42.2 +2.0 Liberal Democrat Anne Lee 16,696 29.9 +1.6 Labour Mark Wells 13,719 24.5 -1.5 Green Stephanie Ross-Wagenknect 1,069 1.9 +1.1 UKIP Joe Neal 856 1.5 +0.9 Majority 6,893 12.3 Turnout 55,929 67.6 -10.7 Conservative hold Swing 0.2 Elections in the 1990s
General Election 1997: South Norfolk Party Candidate Votes % ±% Conservative John MacGregor 24,935 40.2 -12.4 Liberal Democrat B Hacker 17,557 28.3 +1.3 Labour J Ross 16,188 26.1 +8.0 Referendum Party P Bateson 2,533 4.1 +4.1 Green S Ross-Wagenknecht 484 0.8 -0.2 UKIP A Boddy 400 0.6 +0.6 Majority 7,378 11.9 -13.7 Turnout 79,239 78.37 -5.62 Conservative hold Swing -6.8 General Election 1992: South Norfolk[3] Party Candidate Votes % ±% Conservative John MacGregor 36,081 52.6 -0.8 Liberal Democrat Christopher Brocklebank-Fowler 18,516 27.0 -6.9 Labour CJ Needle 12,422 18.1 +5.4 Green S Ross-Wagenknecht 702 1.0 +1.0 Natural Law N Clark 320 0.5 +0.5 Independent R Peacock 304 0.4 +0.4 Independent Conservative R Watkins 232 0.3 +0.3 Majority 17,565 25.6 +6.0 Turnout 68,577 83.99 -3.03 Conservative hold Swing +3.0 Elections in the 1980s
General Election 1987: South Norfolk Party Candidate Votes % ±% Conservative John MacGregor 33,912 53.4 -0.8 Liberal RAP Carden 21,494 33.9 +1.1 Labour L Addison 8,047 12.7 -0.3 Majority 12,418 19.6 -1.8 Turnout 63,453 80.96 +3.75 Conservative hold Swing -0.9 General Election 1983: South Norfolk Party Candidate Votes % ±% Conservative John MacGregor 30,747 54.2 -0.3 Liberal RA Carden 18,612 32.8 +17.5 Labour HA Holzer 7,408 13.0 -17.2 Majority 12,135 21.4 +9.4 Turnout 56,767 77.21 -1.94 Conservative hold Swing +4.7 Elections in the 1970s
General Election 1979: South Norfolk Party Candidate Votes % ±% Conservative John MacGregor 42,792 54.5 +9.0 Labour PJ Davies 23,755 30.2 -2.6 Liberal J Bristol 11,990 15.3 -5.9 Majority 19,037 24.2 +11.5 Turnout 78,537 78.35 +2.15 Conservative hold Swing +5.8 General Election October 1974: South Norfolk Party Candidate Votes % ±% Conservative John MacGregor 31,478 45.5 +1.2 Labour H Gray 22,713 32.8 +3.2 Liberal M Scott 14,687 21.2 -4.4 United Democratic Party CC Fairhead 317 0.5 +0.0 Majority 8,765 12.7 -2.1 Turnout 69195 76.20 -6.59 Conservative hold Swing -1.0 General Election February 1974: South Norfolk Party Candidate Votes % ±% Conservative John MacGregor 33,059 44.3 Labour RJ Truman 22,040 29.6 Liberal M Scott 19,115 25.6 Independent Progressive CC Fairhead 337 0.5 Majority 11,019 14.8 Turnout 74,551 82.79 Conservative hold Swing General Election 1970: South Norfolk Party Candidate Votes % ±% Conservative John Hill 22,614 51.9 Labour C Shaw 17,172 39.4 Liberal BE Goldstone 3,811 8.7 Majority 5,442 12.5 Turnout 43,597 78.50 Conservative hold Swing Elections in the 1950s
General election, 1959: South Norfolk Party Candidate Votes % ±% Conservative John Hill 19,275 53.8 +1.7 Labour J.M. Stewart 16,542 46.2 −1.7 Majority 2,733 7.6 +3.5 Turnout 35,817 82.4 +0.6 Conservative hold Swing +1.7 South Norfolk by-election, January 1955 Party Candidate Votes % ±% Conservative John Hill 15,119 51.5 −3.0 Labour J.M. Stewart 14,254 48.5 +3.0 Majority 865 2.9 −6.1 Turnout 29,373 Conservative hold Swing −3.0 General election, May 1955: South Norfolk Party Candidate Votes % ±% Conservative John Hill 18,690 52.1 +0.6 Labour J.M. Stewart 17,215 47.9 −0.6 Majority 1,475 4.11 +1.2 Turnout 35,905 81.8 Conservative hold Swing +0.6 General election, 1951: South Norfolk Party Candidate Votes % ±% Conservative Peter Baker 19,610 54.5 +4.0 Labour L. Scutts 16,371 45.5 +1.8 Majority 3,239 9.0 +3.2 Turnout 35,981 82.4 −1.2 Conservative hold Swing +1.1 General election, 1950: South Norfolk Party Candidate Votes % ±% Conservative Peter Baker 18,143 50.5 +18.0 Labour Christopher Mayhew 15,714 43.7 −6.6 Liberal G.Q. Bryant 2,097 5.8 N/A Majority 2,439 6.8 N/A Turnout 35,954 83.6 +24.6 Conservative gain from Labour Swing +12.3 Elections in the 1920s
South Norfolk by-election, 1920 Party Candidate Votes % ±% Labour George Edwards 8,594 45.7 +10.0 Coalition Liberal J. H. Batty 6,476 34.5 −29.8 Liberal C. H. Roberts 3,718 19.8 N/A Majority 2,118 11.2 −17.4 Turnout 18,788 58.5% Labour gain from Coalition Liberal Swing See also
Notes and references
- ^ "Electorate Figures - Boundary Commission for England". 2011 Electorate Figures. Boundary Commission for England. 4 March 2011. http://www.boundarycommissionforengland.org.uk/electoral-figures/electoral-figures.htm. Retrieved 13 March 2011.
- ^ a b c Leigh Rayment's Historical List of MPs – Constituencies beginning with "N" (part 2)
- ^ "Politics Resources". Election 1992. Politics Resources. 9 April 1992. http://www.politicsresources.net/area/uk/ge92/ge92index.htm. Retrieved 2010-12-06.
Sources
- Boundaries of Parliamentary Constituencies 1885-1972, compiled and edited by F.W.S. Craig (Parliamentary Reference Publications 1972)
- British Parliamentary Constituencies: A Statistical Compendium, by Ivor Crewe and Anthony Fox (Faber and Faber 1984)
- British Parliamentary Election Results 1832-1885, compiled and edited by F.W.S. Craig (The Macmillan Press 1977)
- British Parliamentary Election Results 1885-1918, compiled and edited by F.W.S. Craig (Macmillan Press 1974)
- British Parliamentary Election Results 1918-1949, compiled and edited by F.W.S. Craig (Macmillan Press, revised edition 1977)
- British Parliamentary Election Results 1950-1973, compiled and edited by F.W.S. Craig (Parliamentary Research Services 1983)
- Social Geography of British Elections 1885-1910. by Henry Pelling (Macmillan 1967)
- Who's Who of British Members of Parliament: Volume I 1832-1885, edited by M. Stenton (The Harvester Press 1976)
- Who's Who of British Members of Parliament, Volume II 1886-1918, edited by M. Stenton and S. Lees (Harvester Press 1978)
- Who's Who of British Members of Parliament, Volume III 1919-1945, edited by M. Stenton and S. Lees (Harvester Press 1979)
- Who's Who of British Members of Parliament, Volume IV 1945-1979, edited by M. Stenton and S. Lees (Harvester Press 1981)
Categories:- Parliamentary constituencies in Norfolk
- United Kingdom Parliamentary constituencies established in 1868


Wikimedia Foundation. 2010.