- South West Norfolk (UK Parliament constituency)
-
South West Norfolk County constituency for the House of Commons 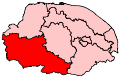
Boundary of South West Norfolk in Norfolk.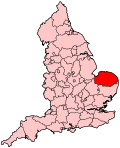
Location of Norfolk within England.County Norfolk Electorate 75,034 (December 2010)[1] Current constituency Created 1885 Member of Parliament Elizabeth Truss (Conservative) Number of members One Overlaps European Parliament constituency East of England South West Norfolk is a parliamentary constituency represented in the House of Commons of the Parliament of the United Kingdom. It elects one Member of Parliament (MP) by the first-past-the-post system of election.
The constituency is composed of the towns of Downham Market, Swaffham and Thetford in Norfolk.
Contents
Boundaries
The current boundaries of South West Norfolk include Watton, Swaffham, Downham Market, Outwell, Upwell, Feltwell, and Attleborough. The seat includes part of King's Lynn and West Norfolk, and Breckland districts.
Following alterations to constituencies in Norfolk, South West Norfolk gains areas from neighbouring North West Norfolk including Walpole, Tilney St Lawrence, and Wiggenhall. It loses to Mid Norfolk areas including Great Ellingham, Watton, and Necton.
History
South West Norfolk has been held solidly by Conservatives since 1964 but for twenty years before then, it had been ultra-marginal. Labour first held it from 1929–31, and Sidney Dye won it for Labour in 1945 with a tiny majority of 53, holding it at the 1950 election by 260. He lost it to Denys Bullard in 1951 by 442 votes and won it back in 1955 with a majority of 193. Dye died at the end of 1958, and in the by-election Albert Hilton retained the seat for Labour by a margin of 1,354 votes. In the 1959 general election that soon followed, his majority was cut to 78.
Although Labour had held the seat during two Conservative national election victories, the Conservatives took the seat in the 1964 election, which Labour won nationally. Paul Hawkins and Gillian Shephard held the seat. Shephard's majority was slashed in the 1997 general election before recovering in the 2001 general election.
Shephard decided not to run for the 2005 general election. The Conservative Party selected Christopher Fraser, former MP for Mid Dorset and Poole North and he was elected with a majority of over 10,000.
On 28 May 2009, Fraser announced that he would be standing down at the 2010 General Election citing family reasons.[2] This was after his expenses claims were highlighted in the Daily Telegraph; according to the newspaper, Fraser claimed £1,800 in public money for buying 215 trees and marking out the boundary of his second home in the constituency.[3]
Members of Parliament
Election Member[4] Party 1885 William Tyssen-Amherst Conservative 1892 Sir Thomas Leigh Hare Conservative 1906 Richard Winfrey Liberal 1923 Alan McLean Conservative 1929 William Benjamin Taylor Labour 1931 Alan McLean Conservative 1935 Somerset de Chair Conservative 1945 Sidney Dye Labour 1951 Denys Bullard Conservative 1955 Sidney Dye Labour 1959 Albert Hilton Labour 1964 Paul Hawkins Conservative 1987 Gillian Shephard Conservative 2005 Christopher Fraser Conservative 2010 Elizabeth Truss Conservative Elections
Elections in the 2010s
General Election 2010: South West Norfolk [5] Party Candidate Votes % ±% Conservative Elizabeth Truss 23,753 48.3 +3.4 Liberal Democrat Stephen Gordon 10,613 21.6 +2.4 Labour Peter Smith 9,119 18.6 -11.4 UKIP Kay Hipsey [6] 3,061 6.2 +1.5 BNP Dennis Pearce[7] 1,774 3.6 +3.6 Green Lori Allen 830 1.7 +1.7 Majority 13,140 26.7 +8.4 Turnout 49,150 66.2 +4.1 Elections in the 2000s
General Election 2005: South West Norfolk Party Candidate Votes % ±% Conservative Christopher Fraser 25,881 46.9 −5.3 Labour Charmaine Morgan 15,795 28.7 −5.8 Liberal Democrat April Pond 10,207 18.5 +7.8 UKIP Delia Hall 2,738 5.0 +2.4 Independent Kim Hayes 506 0.9 N/A Majority 10,086 18.3 Turnout 55,127 62.5 −0.6 Conservative hold Swing +0.3 General Election 2001: South West Norfolk Party Candidate Votes % ±% Conservative Gillian Shephard 27,633 52.2 +10.2 Labour Anne Hanson 18,267 34.5 -3.3 Liberal Democrat Gordon Dean 5,681 10.7 -3.2 UKIP Ian Smith 1,368 2.6 N/A Majority 9,366 17.7 +13.5 Turnout 52,949 63.1 -10.0 Conservative hold Swing +6.7 Elections in the 1990s
General Election 1997: South West Norfolk Party Candidate Votes % ±% Conservative Gillian Shephard 24,694 42.0 −12.6 Labour Adrian Hefferman 22,230 37.8 +10.7 Liberal Democrat David Bucton 8,178 13.9 −6.3 Referendum Party R. Hoare 3,694 6.3 N/A Majority 2,434 4.2 −23.3 Turnout 73.1 −6.2 Conservative hold Swing −11.65 General Election 1992: South West Norfolk[8] Party Candidate Votes % ±% Conservative Gillian Shephard 33,637 54.6 −3.0 Labour Mary Page 16,706 27.1 +6.1 Liberal Democrat John Marsh 11,237 18.2 −3.2 Majority 16,931 27.5 −8.7 Turnout 61,580 79.3 +3.3 Conservative hold Swing −4.6 See also
Notes and references
- ^ "Electorate Figures - Boundary Commission for England". 2011 Electorate Figures. Boundary Commission for England. 4 March 2011. http://www.boundarycommissionforengland.org.uk/electoral-figures/electoral-figures.htm. Retrieved 13 March 2011.
- ^ BBC News; MP Fraser poised to leave Commons, 28 May 2009
- ^ Daily Telegraph MPs' expenses: Christopher Fraser says that claim for trees was necessary 26 May 2009
- ^ Leigh Rayment's Historical List of MPs – Constituencies beginning with "N" (part 2)
- ^ South West Norfolk UKPolling
- ^ http://candidates.ukip.org/index.php?pg=show&eid=399
- ^ http://bnp.org.uk/2010/03/tory-councillors-narrowly-defeated-in-attempt-to-approve-king%E2%80%99s-lynn-mosque-after-bnp-objections-dominate-hearing/
- ^ "UK General Election results April 1992". Richard Kimber's Political Science Resources. Politics Resources. 9 April 1992. http://www.politicsresources.net/area/uk/ge92/i15.htm. Retrieved 2010-12-06.
Sources
Categories:- Parliamentary constituencies in Norfolk
- United Kingdom Parliamentary constituencies established in 1885


Wikimedia Foundation. 2010.