- United States Senate election in Colorado, 2008
-
United States Senate election in Colorado, 2008 
2002 ← November 4, 2008 → 2014 

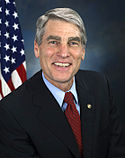
Nominee Mark Udall Bob Schaffer Party Democratic Republican Popular vote 1,230,994 990,755 Percentage 52.8% 42.5%
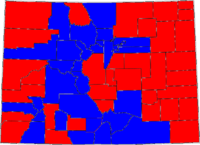
County results
U.S. Senator before election
Elected U.S. Senator
Elections in Colorado 
 Federal government
Presidential elections Presidential primaries U.S. Senate elections 1980 · 1986 · 1992 · 1996 · 1998 · 2002 · 2004 · 2008 · 2010
U.S. House elections  State government
Gubernatorial elections State elections Ballot measures 2004: 36
2006: 38 · 41 · 42 · 43 · 44 · E · F · G · H · I
J · K
2008: 46 · 47 · 48 · 49 · 50 · 51 · 52 · 54
58 · 59 · L Denver
Mayoral elections The 2008 United States Senate election in Colorado was held on November 4, 2008. The primary elections were held August 12, 2008.[1] Incumbent Republican U.S. Senator Wayne Allard decided to retire instead of seeking a third term. Democratic nominee Mark Udall won the open seat.
Contents
Democratic primary
Candidates
- Mark Udall, U.S. Congressman
Results
Democratic primary results[2] Party Candidate Votes Percentage Democratic Mark Udall 194,227 100.00% Totals 194,227 100.00% Republican primary
Candidates
- Bob Schaffer, Colorado State Board of Education member, 2004 Republican candidate for the U.S. Senate, former U.S. Congressman
Results
Republican primary results[3] Party Candidate Votes Percentage Republican Bob Schaffer 239,212 100.00% Totals 239,212 100.00% General election
Campaign
The election featured an open contest because incumbent U.S. Senator Wayne Allard declined to seek re-election. He honored his 1996 pledge to serve no more than two terms in the U.S. Senate and announced that he will retire from his service to the US Senate and not seek a 3rd term, leaving Colorado's Class II Senate seat open. Both parties believed this senate contest would be one of the most competitive senate races during the 2008 election.[4]
Predictions
CQ Politics rated this race as 'Democrat Favored'.[5] The Cook Political Report considered it 'Toss Up'.[6] The Rothenberg Political Report considered it a 'Lean Takeover'.[7]
Polling
Poll Source Dates administered Mark Udall (D) Bob Schaffer (R) Rasmussen Reports October 16, 2008 51% 44% Ciruli Associates October 1, 2008 45% 38% Denver Post September 29 - October 1, 2008 43% 38% Rasmussen Reports September 23, 2008 46% 44% Quinnipiac September 14 - September 21, 2008 48% 40% Public Policy Polling September 21, 2008 48% 40% Tarrance Group September 3, 2008 41% 40% Hill Research Consultants August 24, 2008 41% 38% Rasmussen Reports August 13, 2008 50% 42% Quinnipiac July 24, 2008 44% 44% Rasmussen Reports July 22, 2008 49% 46% Keith Frederick July 22, 2008 48% 39% Public Policy Polling(PPP) July 10, 2008 47% 38% Quinnipiac June 26, 2008 48% 38% Garin-Hart-Yang/DSCC June 15-17, 2008 46% 37% Rasmussen Reports June 17, 2008 49% 40% Rasmussen Reports May 19, 2008 47% 41% Rasmussen Reports April 16, 2008 45% 42% New Leadership USA/TargetPoint March 31-April 7, 2008 45% 45% Rasmussen Reports March 17, 2008 46% 43% McLaughlin & Associates/
Coalition for a Democratic WorkplaceMarch 6-March 9, 2008 44% 32% Rasmussen Reports February 11, 2008 43% 44% Research for Change December 3-December 5, 2007 39% 37% Rasmussen Reports November 28, 2007 41% 42% SurveyUSA October 27-October 30, 2007 48% 41% Ciruli Associates September 12-September 15, 2007 36% 35% Hill Research Consultants August 26-August 28, 2007 45% 40% Results
General election results[8] Party Candidate Votes % ±% Democratic Mark Udall 1,230,994 52.80% +7.03% Republican Bob Schaffer 990,755 42.49% -8.20% Constitution Douglas Campbell 59,733 2.56% +1.04% Green Bob Kinsey 50,004 2.14% Write-ins 135 0.01% Majority 240,239 10.30% +5.38% Turnout 2,331,621 Democratic gain from Republican Swing References
- ^ "Candidate List for the August 12, 2008 Primary Election". Colorado State Government. http://www.elections.colorado.gov/WWW/default/Candidates/primary_election_candidate_list.pdf.
- ^ http://www.sos.state.co.us/pubs/elections/ElectionArchives/2008/2008_Abstract.pdf
- ^ http://www.sos.state.co.us/pubs/elections/ElectionArchives/2008/2008_Abstract.pdf
- ^ Phillips, Kate (2008-06-13). "G.O.P. Leader Maps Senate Elections". The New York Times. http://thecaucus.blogs.nytimes.com/2008/06/13/gop-leader-maps-senate-elections/#more-5357.
- ^ "Race Ratings Chart: Senate". CQ Politics. http://www.cqpolitics.com/wmspage.cfm?docID=ratings-senate.
- ^ "2008 Senate Race Ratings". The Cook Political Report. 2008-10-09. http://www.cookpolitical.com/charts/senate/raceratings_2008-10-09_12-20-35.php.
- ^ 2008 "Senate Ratings". The Rothenberg Political Report. 2008-09-29. http://rothenbergpoliticalreport.blogspot.com/2008/09/2008-senate-ratings_29.html 2008.
- ^ http://clerk.house.gov/member_info/electionInfo/2008/2008Stat.htm#stateCO
External links
- Elections Center from the Colorado Secretary of State
- U.S. Congress candidates for Colorado at Project Vote Smart
- Colorado, U.S. Senate from CQ Politics
- Colorado U.S. Senate from OurCampaigns.com
- Colorado U.S. Senate race from 2008 Race Tracker
- Campaign contributions from OpenSecrets.org
- Schaffer (R) vs Udall (D) graph of multiple polls from Pollster.com
- Official campaign websites
- Bob Kinsey, Green Party candidate
- Bob Schaffer, Republican candidate
- Mark Udall, Democratic candidate
(2007 ←) 2008 United States elections (→ 2009) President U.S. Senate
(Polling)Alabama · Alaska · Arkansas · Colorado · Delaware · Georgia · Idaho · Illinois · Iowa · Kansas · Kentucky · Louisiana · Maine · Massachusetts · Michigan · Minnesota · Mississippi · Mississippi Special · Montana · Nebraska · New Hampshire · New Jersey · New Mexico · North Carolina · Oklahoma · Oregon · Rhode Island · South Carolina · South Dakota · Tennessee · Texas · Virginia · West Virginia · Wyoming · Wyoming Special
U.S. House
(Complete •
Polling)Alabama · Alaska · American Samoa · Arizona · Arkansas · California · Colorado · Connecticut · Delaware · District of Columbia · Florida · Georgia · Guam · Hawaii · Idaho · Illinois · Indiana · Iowa · Kansas · Kentucky · Louisiana · Maine · Maryland · Massachusetts · Michigan · Minnesota · Mississippi · Missouri · Montana · Nebraska · Nevada · New Hampshire · New Jersey · New Mexico · New York · North Carolina · North Dakota · Northern Mariana Islands · Ohio · Oklahoma · Oregon · Pennsylvania · Puerto Rico · Rhode Island · South Carolina · South Dakota · Tennessee · Texas · Utah · Vermont · Virginia (1st, 7th) · United States Virgin Islands · Washington · West Virginia · Wisconsin · Wyoming
U.S. House
(special)Governors
(Polling)American Samoa · Delaware · Indiana · Missouri · Montana · New Hampshire · North Carolina · North Dakota · Puerto Rico · Utah · Vermont · Washington · West Virginia
States Alabama · Alaska · American Samoa · Arizona · Arkansas · California · Colorado · Connecticut · Delaware · Florida · Georgia · Guam · Hawaii · Idaho · Illinois · Indiana · Iowa · Kansas · Kentucky · Louisiana · Maine · Maryland · Massachusetts · Michigan · Minnesota · Mississippi · Missouri · Montana · Nebraska · Nevada · New Hampshire · New Jersey · New Mexico · New York · North Carolina · North Dakota · Ohio · Oklahoma · Oregon · Pennsylvania · Puerto Rico · Rhode Island · South Carolina · South Dakota · Tennessee · Texas · United States Virgin Islands · Utah · Vermont · Virginia · Washington · West Virginia · Wisconsin · Wyoming
Categories:- United States Senate elections, 2008
- United States Senate elections in Colorado
- Colorado elections, 2008
Wikimedia Foundation. 2010.

