- Real estate bubble
-
This article is about the general phenomenon of housing bubbles. For housing bubbles in various countries, see below.
A real estate bubble or property bubble (or housing bubble for residential markets) is a type of economic bubble that occurs periodically in local or global real estate markets. It is characterized by rapid increases in valuations of real property such as housing until they reach unsustainable levels and then decline.
The questions of whether real estate bubbles can be identified and prevented, and whether they have broader macroeconomic significance are answered differently by schools of economic thought, as detailed below. The financial crisis of 2007–2010 was related to the bursting of real estate bubbles around the world, which had begun during the mid 2000s. [1][2]
Contents
Identification and prevention
 Some[who?] argue that a house price index such as the Case-Shiller index allows the identification of real estate bubbles.
As with all types of economic bubbles, whether real estate bubbles can be identified or prevented is contentious. Bubbles are generally not contentious in hindsight, after a peak and crash.
Within mainstream economics, some argue that real estate bubbles cannot be identified as they occur and cannot or should not be prevented, with government and central bank policy rather cleaning up after the bubble bursts.
Others, such as American economist Robert Shiller of the Case-Shiller Home Price Index of home prices in 20 metro cities across the United States, indicated in May 31, 2011 that a "Home Price Double Dip Confirmed"[3] and British magazine The Economist, argue that housing market indicators can be used to identify real estate bubbles. Some argue further that governments and central banks can and should take action to prevent bubbles from forming, or to deflate existing bubbles.
Macroeconomic significance
Within mainstream economics, economic bubbles, and in particular real estate bubbles, are not considered major concerns.[dubious ] Within some schools of heterodox economics, by contrast, real estate bubbles are considered of critical importance and a fundamental cause of financial crises and ensuing economic crises.
The mainstream economic view is that economic bubbles bring about a temporary boost in wealth and a redistribution of wealth. When prices increase, there is a positive wealth effect (property owners feel richer and spend more), and when they decline, there is a negative wealth effect (property owners feel poorer and spend less). These effects, it is argued, can be smoothed by counter-cyclical monetary and fiscal policies. The ultimate effect on owners who bought before the bubble formed and did not sell is zero. Those who bought when low and sold high profited, while those who bought high and sold low (after the bubble has burst) or held until the price fell lost money. This redistribution of wealth, it is also argued, is of little macroeconomic significance.
In some schools of heterodox economics, notably Austrian economics and Post-Keynesian economics, real estate bubbles are seen as an example of credit bubbles (pejoratively, speculative bubbles), because property owners generally use borrowed money to purchase property, in the form of mortgages. These are then argued to cause financial and hence economic crises. This is first argued empirically – numerous real estate bubbles have been followed by economic slumps, and it is argued that there is a cause-effect relationship between these.
The Post-Keynesian theory of debt deflation takes a demand-side view, arguing that property owners not only feel richer but borrow to (i) consume against the increased value of their property --- by taking out a home equity line of credit), for instance; or (ii) speculate by buying property with borrowed money in the expectation that it will rise in value. The latter view is associated with Financial Instability Hypothesis of Hyman Minsky. When the bubble bursts, the value of the property decreases but not the level of debt. The burden of repaying or defaulting on the loan depresses aggregate demand, it is argued, and constitutes the proximate cause of the subsequent economic slump.
 Melbourne House Prices and Wages 1965 to 2010
Recent real estate bubbles
1990: Japan
The crash of the Japanese asset price bubble from 1990 on has been very damaging to the Japanese economy,[4]. The crash in 2005 affected Shanghai, China's largest city.[5] In comparison to the stock-market bubbles, real estate bubbles take longer to deflate: prices decline slower because the real estate market is less liquid. Commercial real estate generally moves in tandem with the residential properties, since both are affected by many of same factors (e.g., interest rates) and share the "wealth effect" of booms.[original research?] Therefore this article focuses on housing bubbles and mentions other sectors only when their situation differs.
2007: many countries
As of 2007[update], real estate bubbles had existed in the recent past or were widely believed to still exist in many parts of the world,[6] especially in the United States, Argentina,[7] Britain, Netherlands, Italy, Australia, New Zealand, Ireland, Spain, Lebanon, France, Poland,[8] South Africa, Israel, Greece, Bulgaria, Croatia,[9] Norway, Singapore, South Korea, Sweden, Baltic states, India, Romania, Russia, Ukraine and China.[10] Then U.S. Federal Reserve Chairman Alan Greenspan said in mid-2005 that "at a minimum, there's a little 'froth' (in the U.S. housing market) … it's hard not to see that there are a lot of local bubbles."[11] The Economist magazine, writing at the same time, went further, saying "the worldwide rise in house prices is the biggest bubble in history".[12] Real estate bubbles are invariably followed by severe price decreases (also known as a house price crash) that can result in many owners holding. As of the end of 2010, 11.1 million residential properties, or 23.1% of all U.S. homes, were in negative equity at Dec. 31, 2010.[13] Commercial property values remain around 35% below their mid-2007 peak in the United Kingdom.[14] As a result, banks have become less willing to hold large amounts of property backed debt, a likely key issue in affecting a recovery worldwide in the near term.
Housing market indicators
 UK house prices between 1975 and 2006 adjusted for inflation.
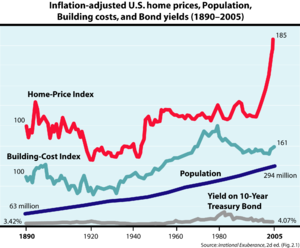 Robert Shiller's plot of U.S. home prices, population, building costs, and bond yields, from Irrational Exuberance, 2d ed. Shiller shows that inflation adjusted U.S. home prices increased 0.4% per year from 1890–2004, and 0.7% per year from 1940–2004, whereas U.S. census data from 1940–2004 shows that the self-assessed value increased 2% per year.
In attempting to identify bubbles before they burst, economists have developed a number of financial ratios and economic indicators that can be used to evaluate whether homes in a given area are fairly valued. By comparing current levels to previous levels that have proven unsustainable in the past (i.e. led to or at least accompanied crashes), one can make an educated guess as to whether a given real estate market is experiencing a bubble. Indicators describe two interwoven aspects of housing bubble: a valuation component and a debt (or leverage) component. The valuation component measures how expensive houses are relative to what most people can afford, and the debt component measures how indebted households become in buying them for home or profit (and also how much exposure the banks accumulate by lending for them). A basic summary of the progress of housing indicators for U.S. cities is provided by Business Week.[15] See also: real estate economics and real estate trends.
Housing affordability measures
- The price to income ratio is the basic affordability measure for housing in a given area. It is generally the ratio of median house prices to median familial disposable incomes, expressed as a percentage or as years of income. It is sometimes compiled separately for first time buyers and termed attainability.[citation needed] This ratio, applied to individuals, is a basic component of mortgage lending decisions.[citation needed] According to a back-of-the-envelope calculation by Goldman Sachs, a comparison of median home prices to median household income suggests that U.S. housing in 2005 is overvalued by 10%. "However, this estimate is based on an average mortgage rate of about 6%, and we expect rates to rise," the firm's economics team wrote in a recent report.[16] According to Goldman's figures, a one-percentage-point rise in mortgage rates would reduce the fair value of home prices by 8%.[citation needed]
- The deposit to income ratio is the minimum required downpayment for a typical mortgage[specify], expressed in months or years of income. It is especially important for first-time buyers without existing home equity; if the downpayment becomes too high then those buyers may find themselves "priced out" of the market. For example, as of 2004[update] this ratio was equal to one year of income in the UK.[17]
Another variant is what the United States's National Association of Realtors calls the "housing affordability index" in its publications.[18] (The NAR's methodology was criticized by some analysts as it does not account for inflation.[19] Other analysts, however, consider the measure appropriate, because both the income and housing cost data is expressed in terms that include inflation and, all things being equal, the index implicitly includes inflation[citation needed]). In either case, the usefulness of this ratio in identifying a bubble is debatable; while downpayments normally increase with house valuations, bank lending becomes increasingly lax during a bubble and mortgages are offered to borrowers who would not normally qualify for them (see Housing debt measures, below).[original research?]
- The Affordability Index measures the ratio of the actual monthly cost of the mortgage to take-home income. It is used more in the United Kingdom where nearly all mortgages are variable and pegged to bank lending rates. It offers a much more realistic measure of the ability of households to afford housing than the crude price to income ratio. However it is more difficult to calculate, and hence the price to income ratio is still more commonly used by pundits. In recent years, lending practices have relaxed, allowing greater multiples of income to be borrowed. Some speculate that this practice in the longterm cannot be sustained and may ultimately lead to unaffordable mortgage payments, and repossession for many.[citation needed]
- The Median Multiple measures the ratio of the median house price to the median annual household income. This measure has historically hovered around a value of 3.0 or less, but in recent years has risen dramatically, especially in markets with severe public policy constraints on land and development.[citation needed]
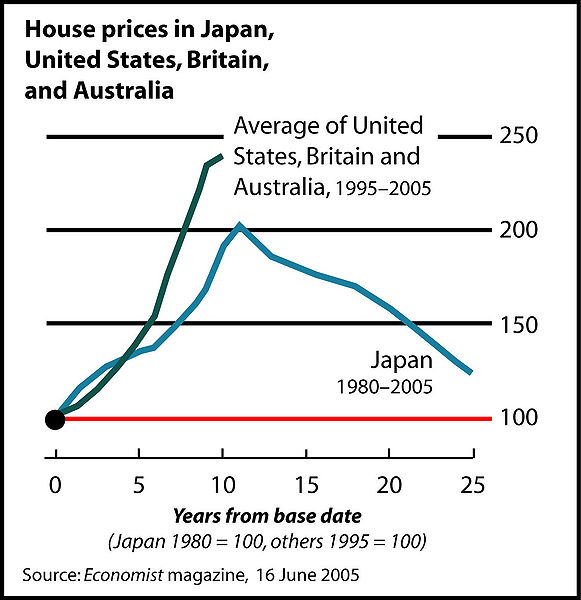
 Inflation-adjusted home prices in Japan (1980–2005) compared to home price appreciation in the United States, Britain, and Australia (1995–2005).
Housing debt measures
- The housing debt to income ratio or debt-service ratio is the ratio of mortgage payments to disposable income. When the ratio gets too high, households become increasingly dependent on rising property values to service their debt. A variant of this indicator measures total home ownership costs, including mortgage payments, utilities and property taxes, as a percentage of a typical household's monthly pre-tax income; for example see RBC Economics' reports for the Canadian markets.[20]
- The housing debt to equity ratio (not to be confused with the corporate debt to equity ratio), also called loan to value, is the ratio of the mortgage debt to the value of the underlying property; it measures financial leverage. This ratio increases when the homeowner takes a second mortgage or home equity loan using the accumulated equity as collateral. A ratio greater higher than 1 implies that owner's equity is negative.
Housing ownership and rent measures
- The ownership ratio is the proportion of households who own their homes as opposed to renting. It tends to rise steadily with incomes. Also, governments often enact measures such as tax cuts or subsidized financing to encourage and facilitate home ownership. If a rise in ownership is not supported by a rise in incomes, it can mean either that buyers are taking advantage of low interest rates (which must eventually rise again as the economy heats up) or that home loans are awarded more liberally, to borrowers with poor credit. Therefore a high ownership ratio combined with an increased rate of subprime lending may signal higher debt levels associated with bubbles.
- The price-to-earnings ratio or P/E ratio is the common metric used to assess the relative valuation of equities. To compute the P/E ratio for the case of a rented house, divide the price of the house by its potential earnings or net income, which is the market annual rent of the house minus expenses, which include maintenance and property taxes. This formula is:
-
- The house price-to-earnings ratio provides a direct comparison to P/E ratios used to analyze other uses of the money tied up in a home. Compare this ratio to the simpler but less accurate price-rent ratio below.
- The price-rent ratio is the average cost of ownership divided by the received rent income (if buying to let) or the estimated rent that would be paid if renting (if buying to reside):
-
- The latter is often measured using the "owner's equivalent rent" numbers published by the Bureau of Labor Statistics. It can be viewed as the real estate equivalent of stocks' price-earnings ratio; in other terms it measures how much the buyer is paying for each dollar of received rent income (or dollar saved from rent spending). Rents, just like corporate and personal incomes, are generally tied very closely to supply and demand fundamentals; one rarely sees an unsustainable "rent bubble" (or "income bubble" for that matter). Therefore a rapid increase of home prices combined with a flat renting market can signal the onset of a bubble. The U.S. price-rent ratio was 18% higher than its long-run average as of October 2004.[21]
- The gross rental yield, a measure used in the United Kingdom, is the total yearly gross rent divided by the house price and expressed as a percentage:
-
- This is the reciprocal of the house price-rent ratio. The net rental yield deducts the landlord's expenses (and sometimes estimated rental voids) from the gross rent before doing the above calculation; this is the reciprocal of the house P/E ratio.
- Because rents are received throughout the year rather than at its end, both the gross and net rental yields calculated by the above are somewhat less than the true rental yields obtained when taking into account the monthly nature of rental payments.
- The occupancy rate (opposite: vacancy rate) is essentially the number of occupied units divided by the total number of units in a given region (in commercial real estate, it is usually expressed in terms of area such as square meters for different grades of buildings). A low occupancy rate means that the market is in a state of oversupply brought about by speculative construction and purchase. In this context, supply-and-demand numbers can be misleading: sales demand exceeds supply, but rent demand does not.
Housing price indices
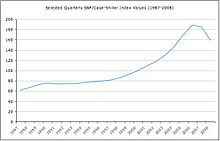
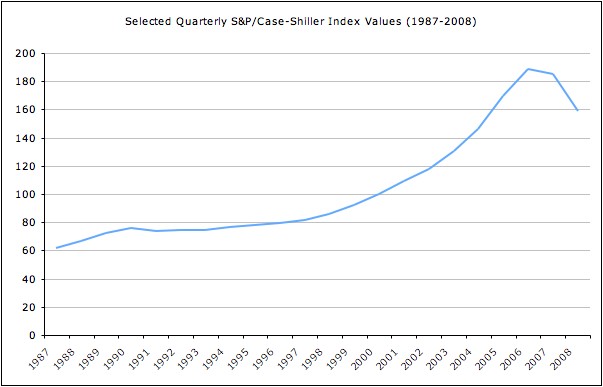
The Case–Shiller index (national, quarterly) 1987–2008, showing a housing bubble peaking in 2006.Measures of house price are also used in identifying housing bubbles; these are known as house price indices (HPIs).
A noted series of HPIs for the United States are the Case–Shiller indices, devised by American economists Karl Case, Robert J. Shiller, and Allan Weiss. As measured by the Case–Shiller index, the US experienced a housing bubble peaking in the second quarter of 2006 (2006 Q2).
Real estate bubbles in the 2000s
By 2006, several areas of the world were thought to be in a bubble state, although this contention was not without controversy. This hypothesis was based on observation of similar patterns in real estate markets of a wide variety of countries.[22] This includes similar patterns of overvaluation and excessive borrowing based on those overvaluations.
The subprime mortgage crisis, with its accompanying impacts and effects on economies in various nations, has given some credence to the idea that these trends might have some common characteristics.[6]
For individual countries, see:
- Australian property bubble
- British property bubble
- Bulgarian property bubble
- Canadian property bubble
- Chinese property bubble
- Danish property bubble
- Indian property bubble
- Irish property bubble
- Israel's housing bubble
- Japanese asset price bubble
- Lebanese property bubble
- Polish property bubble
- Romanian property bubble
- South Korean property bubble
- Spanish property bubble
- United States housing bubble
- Greek property bubble
See also
- Real estate pricing
- Real estate appraisal
- Real estate economics
- Deed in lieu of foreclosure
- Economic bubble
- Foreclosure consultant
- Category:Real estate bubbles of 2000s
- Estate (house)
References
- ^ Michael Simkovic, "Competition and Crisis in Mortgage Securitization"
- ^ Klein, Ezra (2009-05-28). "Bill Clinton and the Housing Bubble". Washington Post. http://voices.washingtonpost.com/ezra-klein/2009/05/bill_clinton_and_the_housing_b.html. Retrieved 2011-09-22.
- ^ Christie, Les (May 31, 2011). "Home prices: 'Double-dip' confirmed". CNN Money. http://money.cnn.com/2011/05/31/real_estate/march_home_prices/index.htm.
- ^ Fackler, Martin (December 25, 2005). "Take It From Japan: Bubbles Hurt". New York Times. http://www.nytimes.com/2005/12/25/business/yourmoney/25japan.html?pagewanted=all. Retrieved 2009-06-23.
- ^ Lee, Don (January 8, 2006). "A Home Boom Busts". Los Angeles Times. http://articles.latimes.com/2006/jan/08/business/fi-chinabubble8. Retrieved 2009-06-23.
- ^ a b Putland, Gavin R. (June 1, 2009). "From the subprime to the terrigenous: Recession begins at home". Land Values Research Group. http://lvrg.org.au/blog/2009/06/from-subprime-to-terrigenous-recession.html. Retrieved 2009-06-23.
- ^ "The good times are here again". Global Property Guide. February 28, 2008. http://www.globalpropertyguide.com/Latin-America/Argentina/Price-History. Retrieved 2009-06-23.
- ^ "The end of Poland’s house price boom". Global Property Guide. August 25, 2008. http://www.globalpropertyguide.com/Europe/Poland/Price-History. Retrieved 2009-06-23.
- ^ "Real estate prices in Adriatic Coast up, Zagreb down". Global Property Guide. August 19, 2008. http://www.globalpropertyguide.com/Europe/Croatia/Price-History. Retrieved 2009-06-23.
- ^ "Looming housing slump in China". Global Property Guide. September 1, 2008. http://www.globalpropertyguide.com/Asia/China/Price-History. Retrieved 2009-06-23.
- ^ Leonhardt, David (December 25, 2005). "2005: In a Word: Frothy". New York Times. http://www.nytimes.com/2005/12/25/weekinreview/25track.ready.html?pagewanted=all. Retrieved 2009-06-23.
- ^ "The global housing boom". The Economist. June 16, 2005. http://www.economist.com/opinion/displaystory.cfm?story_id=4079027.
- ^ Philyaw, Jason. "Underwater mortgages back above 11 million in 4Q". CoreLogic.
- ^ PropertyMall http://www.propertymall.com/press/article/24577
- ^ "Interactive Table: How Bubbly Is Your Housing Market?". Business Week. April 11, 2005. Archived from the original on Nov 20, 2007. http://web.archive.org/web/20071130085352/http://bwnt.businessweek.com/housing_boom/index.asp. Retrieved 2009-06-23.
- ^ [1][dead link]
- ^ Nottingham Trent University paper[dead link]
- ^ "Affordable Housing Real Estate Resource: Housing Affordability Index". National Association of Realtors. http://www.realtor.org/research/research/housinginx. Retrieved 2009-06-23.
- ^ [2][dead link]
- ^ June 2, 2005 report[dead link]
- ^ Krainer, John; Wei, Chishen (October 1, 2004). House Prices and Fundamental Value. Federal Reserve Bank of San Francisco. http://www.frbsf.org/publications/economics/letter/2004/el2004-27.html.
- ^ "House Prices Worldwide". Global Property Guide. http://www.globalpropertyguide.com/real-estate-house-prices/A. Retrieved 2009-06-23.
External links
- Barron's Magazine
- John Calverley (2004), Bubbles and how to survive them, N. Brealey. ISBN 1-85788-348-9
- The Economist, December 8, 2005, "Hear that hissing sound?."
- The Economist, June 16, 2005, "After the fall."
- The Economist, June 16, 2005, "In come the waves."
- The Economist, April 20, 2005, "Will the walls come falling down?"
- The Economist, May 3d, 2005, "Still want to buy?"
- The Economist, May 29, 2003, "House of cards."
- The Economist, May 28, 2002, "Going through the roof."
- Fred Foldvary (1997). "The Business Cycle: A Georgist-Austrian Synthesis." American Journal of Economics and Sociology 56 (4) (October 1997): 521–41.
- Gjerstad, Steven; and Vernon L. Smith (2009-04-06). "From Bubble to Depression? Why the Housing Bubble Crashed the Financial System but the Dot-com Bubble Did Not". Wall Street Journal: p. A15. http://online.wsj.com/article/SB123897612802791281.html.
- The New York Times, December 25, 2005, Take It From Japan: Bubbles Hurt.
- Robert Kiyosaki (2005). All Booms Bust, Rich Dad, Poor Dad
- Burton G. Malkiel (2003). The Random Walk Guide to Investing: Ten Rules for Financial Success, New York: W. W. Norton and Company, Inc. ISBN 0-393-05854-9.
- Robert J. Shiller (2005). Irrational Exuberance, 2d ed. Princeton University Press. ISBN 0-691-12335-7.
- John R. Talbott (2003). The Coming Crash in the Housing Market, New York: McGraw-Hill, Inc. ISBN 0-07-142220-X.
- Andrew Tobias (2005). The Only Investment Guide You'll Ever Need (updated ed.), Harcourt Brace and Company. ISBN 0-15-602963-4.
- Eric Tyson (2003). Personal Finance for Dummies, 4th ed., Foster City, CA: IDG Books. ISBN 0-7645-2590-5.
- Benjamin Wallace-Wells, "There goes the neighborhood", Washington Monthly, 2004 April.
- Elizabeth Warren and Amelia Warren Tyagi (2003). The Two-Income Trap: Why Middle Class Mothers and Fathers are Going Broke, New York: Basic Books. ISBN 0-465-09082-6.
- Dean Baker, Financial Bubbles (Stocks and Housing) and How You Can Protect Yourself Against Them, Center for Economic and Policy Research Economics Seminar Series.[3]Center for Economic and Policy Research
- Is the Housing Bubble Collapsing? 10 Indicators to WatchPDF (153 KiB) Report by Dean Baker, June 2006
- When Bubbles BurstPDF (354 KiB), World Economic Outlook, International Monetary Fund, April 2003.
- Where should house prices really be and how did they get so high? 2008 Analysis of how the US Real Estate Bubble developed and historical house price to income ratios that show just how big the bubble was and how far house prices are likely to fall.
- The Global House Price BoomPDF (367 KiB), World Economic Outlook, International Monetary Fund, September 2004.
- California’s Real Estate Bubble by Fred E. Foldvary, covers the California, U.S., and global bubble from a libertarian perspective.
- Demographia International Housing Affordability Survey Comparative housing affordability for 100 large markets in the U.S., U.K., Canada, Australia, New Zealand and Ireland.
- Are housing prices, household debt, and growth sustainable?PDF (342 KiB), Levy Economics Institute of Bard College, January 2006.
- Spanish Property Market Summary (Data Included from 1985 to 2010)PDF (459 KiB) Kyero.com, July 2010
- 35 years of house price in Vancouver BC as a rollercoaster currently the least affordable market in North America.
- Rio Real Estate Shielded From Burst
- Housing Bubble Detection, J F Bellod
Categories:- Real estate bubbles
- Economic problems
- Economic bubbles


Wikimedia Foundation. 2010.