- Torridge and West Devon (UK Parliament constituency)
-
Coordinates: 50°42′54″N 4°15′47″W / 50.715°N 4.263°W
Torridge and West Devon County constituency for the House of Commons 
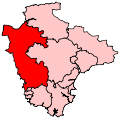
Boundary of Torridge and West Devon in Devon.
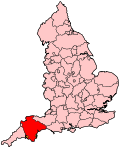
Location of Devon within England.County Devon Electorate 77,417 (December 2010)[1] Current constituency Created 1983 Member of Parliament Geoffrey Cox (Conservative) Number of members One Overlaps European Parliament constituency South West England Torridge and West Devon is a county constituency represented in the House of Commons of the Parliament of the United Kingdom.
It returns one Member of Parliament (MP), elected by the first-past-the-post voting system.
Contents
Boundaries
Prior to the 2010 general election, the constituency covered the entirety of the two districts from which it takes its name, Torridge and West Devon (apart from one West Devon ward). However, following a review of parliamentary representation in Devon by the Boundary Commission for England, which has increased the number of seats in the county from 11 to 12, the town of Okehampton and the area surrounding it have been transferred to the new Central Devon seat.[2]
The main towns within the constituency are now Bideford, Great Torrington, Holsworthy and Tavistock; the constituency also includes the island of Lundy.
Members of Parliament
Election Member [3] Party 1983 Peter Mills Conservative 1987 Emma Nicholson Conservative 1995 Liberal Democrat 1997 John Burnett Liberal Democrat 2005 Geoffrey Cox Conservative Elections
Elections in the 2010s
General Election 2010: Torridge and West Devon[4][5] Party Candidate Votes % ±% Conservative Geoffrey Cox 25,230 45.7 +3.4 Liberal Democrat Adam Symons 22,273 40.3 +3.4 UKIP Robin Julian 3,021 5.5 -0.9 Labour Darren Jones 2,917 5.3 -5.3 Green Cathrine Simmons 1,050 1.9 -2.0 BNP Nick Baker 766 1.4 +1.4 Majority 2,957 5.4 Turnout 55,257 71.4 +0.2 Conservative hold Swing 0.0 Elections in the 2000s
General Election 2005: Torridge and West Devon Party Candidate Votes % ±% Conservative Geoffrey Cox 25,013 42.7 +2.7 Liberal Democrat David Walter 21,777 37.2 -5.0 Labour Rebecca Richards 6,001 10.2 -0.5 UKIP Matthew Jackson 3,790 6.5 +1.7 Green Peter Christie 2,003 3.4 +1.1 Majority 3,236 5.5 Turnout 58,584 70.2 -0.3 Conservative gain from Liberal Democrat Swing +3.9 General Election 2001: Torridge and West Devon Party Candidate Votes % ±% Liberal Democrat John Burnett 23,474 42.2 +0.3 Conservative Geoffrey Cox 22,280 40.0 +1.5 Labour David Brenton 5,959 10.7 -1.7 UKIP Bob Edwards 2,674 4.8 +1.7 Green Martin Quinn 1,297 2.3 N/A Majority 1,194 2.2 Turnout 55,684 70.5 -7.4 Liberal Democrat hold Swing Elections in the 1990s
General Election 1997: Torridge and West Devon[6] Party Candidate Votes % ±% Liberal Democrat John Burnett 24,744 41.84 Conservative Ian Liddell-Grainger 22,787 38.53 Labour David Brenton 7,319 12.38 Referendum Party Roger Lea 1,946 3.29 UKIP Matthew Jackson 1,841 3.11 Liberal Michael Pithouse 508 0.86 Majority 1,957 3.31 Turnout 59,148 77.91 General Election 1992: Torridge and West Devon[7] Party Candidate Votes % ±% Conservative Emma Nicholson 29,627 47.3 −3.0 Liberal Democrat DI McBride 26,013 41.5 +2.3 Labour DG Brenton 5,997 9.6 +1.1 Green F Williamson 898 1.4 −0.6 Natural Law DH Collins 141 0.2 +0.2 Majority 3,614 5.8 −5.3 Turnout 62,676 81.5 +2.8 Conservative hold Swing −2.6 See also
Notes and references
- ^ "Electorate Figures - Boundary Commission for England". 2011 Electorate Figures. Boundary Commission for England. 4 March 2011. http://www.boundarycommissionforengland.org.uk/electoral-figures/electoral-figures.htm. Retrieved 13 March 2011.
- ^ "Final recommendations for Parliamentary constituencies in the counties of Devon, Plymouth and Torbay". Boundary Commission for England. 2004-11-24. http://www.boundarycommissionforengland.org.uk/review_areas/downloads/FR_NR_Devon_Plymouth_Torbay.doc. Retrieved 2010-04-25.[dead link]
- ^ Leigh Rayment's Historical List of MPs – Constituencies beginning with "D" (part 2)
- ^ "Statement of Persons Nominated and Notice of Poll: Torridge and West Devon" (PDF). West Devon Borough Council. 2010-04-20. http://www.westdevon.gov.uk/upload/public/attachments/1038/TandWDStatement%20of%20Persons%20Nominated.pdf. Retrieved 2010-04-25.
- ^ "BBC NEWS – Election 2010 – Devon West & Torridge". BBC News. http://news.bbc.co.uk/1/shared/election2010/results/constituency/e75.stm.
- ^ http://www.politicsresources.net/area/uk/constit/317.htm
- ^ "Politics Resources". Election 1992. Politics Resources. 9 April 1992. http://www.politicsresources.net/area/uk/ge92/ge92index.htm. Retrieved 2010-12-06.
Constituencies in South West England (55) Conservative (36) Bournemouth East · Bournemouth West · Bridgwater and West Somerset · Bristol North West · Camborne and Redruth · Central Devon · Christchurch · Devizes · East Devon · Filton and Bradley Stoke · Forest of Dean · Gloucester · Kingswood · Newton Abbot · North Dorset · North East Somerset · North Somerset · North Swindon · North Wiltshire · Plymouth Sutton and Devonport · Poole · Salisbury · South Dorset · South East Cornwall · South Swindon · South West Devon · South West Wiltshire · Stroud · Tewkesbury · The Cotswolds · Tiverton and Honiton · Torridge and West Devon · Totnes · Truro and Falmouth · West Dorset · Weston-super-Mare
Liberal Democrats (15) Labour (4) South West England European constituency: Conservative (3) · UKIP (2) · Liberal Democrats (1)
Categories:- Parliamentary constituencies in Devon
- United Kingdom Parliamentary constituencies established in 1983
Wikimedia Foundation. 2010.
