- North Devon (UK Parliament constituency)
-
North Devon County constituency for the House of Commons 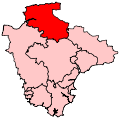
Boundary of North Devon in Devon.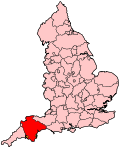
Location of Devon within England.County Devon Electorate 75,098 (December 2010)[1] Current constituency Created 1950 Member of Parliament Nicholas Harvey (Liberal Democrat) Number of members One 1832–1885 Number of members Two Type of constituency County constituency Created from Devon Overlaps European Parliament constituency South West England North Devon is a county constituency represented in the House of Commons of the Parliament of the United Kingdom. It elects one Member of Parliament (MP) by the first-past-the-post system of election.
A previous two-seat constituency of the same name existed from 1832 to 1885, formally titled the Northern Division of Devon.
Contents
Boundaries
Following a review of parliamentary representation in Devon by the Boundary Commission for England, which increased the number of seats in the county from 11 to 12, as of the 2010 general election the North Devon constituency has identical boundaries to the North Devon district.[2] Prior to 2010, it covered a slightly larger area to the south, including some wards from the Mid Devon district.
History
The North Devon constituency was first created for the 1832 general election, when the Reform Act 1832 divided the former two-seat Devon constituency into Northern and Southern divisions, each of which elected two MPs using the bloc vote system of election. The constituency was abolished for the 1885 general election, when the Redistribution of Seats Act split the county up into new single-seat divisions. A new North Devon constituency was created at the 1950 general election, covering a smaller area than before.
The Liberal Democrats and their predecessors the Liberal Party have historically shown a strong performance in this seat, which was held for twenty years by former Liberal leader Jeremy Thorpe. He lost it in the 1979 general election amid a scandal surrounding his relationship with homosexual Norman Scott, and alleged involvement in a plot to murder him, of which he was found not guilty the same year. At the 1992 general election, Liberal Democrat Nick Harvey regained the seat from the Conservatives, and has been the MP since.
Members of Parliament
MPs 1832–1885
Election 1st Member [3] 1st Party 2nd Member[3] 2nd Party 1832 Viscount Ebrington Whig Hon. Newton Fellowes Whig 1837 Sir Thomas Dyke Acland, Bt Conservative 1839 by-election Lewis William Buck Conservative 1857 James Wentworth Buller Liberal Hon. Charles Hepburn-Stuart-Forbes-Trefusis Conservative 1865 by-election Sir Thomas Dyke Acland, Bt Liberal 1866 by-election Sir Stafford Northcote, Bt Conservative 1885 by-election John Moore-Stevens Conservative 1885 constituency abolished by Redistribution of Seats Act MPs since 1950
The Member of Parliament for the constituency since 1992 is Nick Harvey of the Liberal Democrats.
Election Member [3] Party 1950 Christopher Peto Conservative 1955 James Lindsay Conservative 1959 Jeremy Thorpe Liberal 1979 Tony Speller Conservative 1992 Nick Harvey Liberal Democrat Elections
Elections in the 2010s
General Election 2010: North Devon[4] Party Candidate Votes % ±% Liberal Democrat Nicholas Harvey 24,305 47.4 0.9 Conservative Philip Milton 18,484 36.0 0.3 UKIP Stephen Crowther 3,720 7.2 2.0 Labour Mark Cann 2,671 5.2 -3.7 Green L'Anne Knight 697 1.4 -2.3 BNP Gary Marshall 614 1.2 N/A Independent Rodney Cann 588 1.1 N/A English Democrats Nigel Vidler 146 0.3 N/A Communist Gerry Sables 96 0.2 N/A Majority 5,821 11.3 Turnout 51,321 68.9 +0.6 Liberal Democrat hold Swing +0.3 Elections in the 2000s
General Election 2005: North Devon Party Candidate Votes % ±% Liberal Democrat Nicholas Harvey 23,840 45.9 +1.7 Conservative Orlando Fraser 18,868 36.3 -1.9 Labour Mark Cann 4,656 9.0 -1.1 UKIP John Browne 2,740 5.3 +0.3 Green Ricky Knight 1,826 3.5 +1.1 Majority 4,972 9.6 Turnout 51,930 68.1 -0.2 Liberal Democrat hold Swing -1.8 General Election 2001: North Devon Party Candidate Votes % ±% Liberal Democrat Nicholas Harvey 21,784 44.2 -6.6 Conservative Clive Allen 18,800 38.2 -1.3 Labour Vivian Gale 4,995 10.1 +0.3 UKIP Roger Knapman 2,484 5.0 +5.0 Green Anthony Bown 1,191 2.4 +2.4 Majority 2,984 6.1 -5.2 Turnout 49,254 68.3 -9.4 Liberal Democrat hold Swing Elections in the 1990s
General Election 1997: North Devon Party Candidate Votes % ±% Liberal Democrat Nicholas Harvey 27,824 50.8 Conservative Richard Ashworth 21,643 39.5 Labour Annie Brenton 5,347 9.8 Majority 6,181 11.3 Turnout 54,814 77.7 Liberal Democrat hold Swing General Election 1992: North Devon[5] Party Candidate Votes % ±% Liberal Democrat Nicholas Harvey 27,414 47.1 +4.3 Conservative Tony Speller 26,620 45.7 −5.2 Labour PB Donner 3,410 5.9 −0.4 Green Ms. CH Simmons 658 1.1 +1.1 Natural Law GC Treadwell 107 0.2 N/A Majority 794 1.4 −6.7 Turnout 58,209 84.4 +2.7 Liberal Democrat gain from Conservative Swing +4.7 Elections in the 1980s
General Election 1987: North Devon Party Candidate Votes % ±% Conservative Antony Speller 28,071 50.9 Liberal M. Pinney 23,602 42.8 Labour A. Marjoram 3,467 6.3 Majority 4,469 8.1 Turnout 81.7 General Election 1983: North Devon Party Candidate Votes % ±% Conservative Antony Speller 28,066 55.1 Liberal Roger Blackmore 19,339 37.9 Labour Peter James 2,893 5.7 Ecology R. Joanes 669 1.3 Majority 8,727 17.2 Turnout 80.1 Elections in the 1970s
General Election 1979: North Devon Party Candidate Votes % ±% Conservative Antony Speller 31,811 50.1 Liberal Jeremy Thorpe 23,338 36.7 Labour A. Saltern 7,108 11.2 Ecology A. Whittaker 729 1.2 National Front J. Price 237 0.4 English National Frank Hansford-Miller 142 0.2 Dog Lover's Party Auberon Waugh 79 0.1 Wessex Regionalist Henrietta Rous 50 0.1 Democratic Monarchist Public Safety White Resident Bill Boaks 20 0.0 Majority 8,473 13.3 Turnout 81.7 General Election October 1974: North Devon Party Candidate Votes % ±% Liberal Jeremy Thorpe 28,209 48.1 Conservative Antony Speller 21,488 36.6 Labour Mrs Alexandra Golant 8,536 14.2 English National Frank Hansford-Miller 568 1.0 Majority 6,721 11.5 Turnout 58,621 74.58 General Election February 1974: North Devon Party Candidate Votes % ±% Liberal John Jeremy Thorpe 34,052 53.9 Conservative Timothy Carlton Keigwin 22,980 36.4 Labour T.K. Marston 6,140 9.7 Majority 11,072 17.5 Turnout 63,172 86.49 General Election 1970: North Devon Party Candidate Votes % ±% Liberal John Jeremy Thorpe 18,893 44.1 Conservative Timothy Carlton Keigwin 18,524 43.2 Labour Christopher John Mullin 5,268 12.3 Democratic Party Barry Gray Morris 175 0.4 Majority 369 0.9 Turnout 42,660 84.47 Elections in the 1960s
General Election 1966: North Devon Party Candidate Votes % ±% Liberal Jeremy Thorpe 16,797 43.57 Conservative Tim Keigwin 15,631 40.54 Labour J.H. Rayner 6,127 15.89 Majority 1,166 3.02 Turnout 38,555 85.31 General Election 1964: North Devon Party Candidate Votes % ±% Liberal Jeremy Thorpe 19,031 50.71 Conservative Michael Peto 13,895 37.02 Labour Frank Paton 4,603 12.27 Majority 5,136 13.69 Turnout 37,529 84.32 Elections in the 1950s
General Election 1959: North Devon Party Candidate Votes % ±% Liberal Jeremy Thorpe 15,831 42.94 Conservative James Lindsay 15,469 41.96 Labour Geoffrey Pitt 5,567 15.10 Majority 362 0.98 Turnout 36,867 84.78 General Election 1955: North Devon Party Candidate Votes % ±% Conservative James Lindsay 16,784 47.13 Liberal Jeremy Thorpe 11,558 32.45 Labour H. Heslop 7,272 20.42 Majority 5,226 14.67 Turnout 35,614 81.11 General Election 1951: North Devon Party Candidate Votes % ±% Conservative Brigadier Christopher Peto 19,780 52.41 Labour W.H. Wilkey 10,632 28.17 Liberal G.A. Halse 7,326 19.41 Majority 9,148 24.24 Turnout 35,614 81.11 General Election 1950: North Devon Party Candidate Votes % ±% Conservative Brigadier Christopher Peto 17,724 46.33 Liberal G. Naylor 11,640 30.43 Labour Major W.A. Barker 8,892 23.24 Majority 6,084 15.90 Turnout 38,256 85.69 See also
Notes and references
- ^ "Electorate Figures - Boundary Commission for England". 2011 Electorate Figures. Boundary Commission for England. 4 March 2011. http://www.boundarycommissionforengland.org.uk/electoral-figures/electoral-figures.htm. Retrieved 13 March 2011.
- ^ "Final recommendations for Parliamentary constituencies in the counties of Devon, Plymouth and Torbay". Boundary Commission for England. 2004-11-24. http://www.boundarycommissionforengland.org.uk/review_areas/downloads/FR_NR_Devon_Plymouth_Torbay.doc. Retrieved 2010-04-25.[dead link]
- ^ a b c Leigh Rayment's Historical List of MPs – Constituencies beginning with "D" (part 2)
- ^ Pratt, D J (20 April 2010). "Statement of Persons Nominated and Notice of Poll" (MS Word). Acting Returning Officer, North Devon Council. http://www.northdevon.gov.uk/statement_of_persons_nominated.doc. Retrieved 21 April 2010.
- ^ "Politics Resources". Election 1992. Politics Resources. 9 April 1992. http://www.politicsresources.net/area/uk/ge92/ge92index.htm. Retrieved 2010-12-06.
Sources
- The Times House of Commons 1945. 1945.
- The Times House of Commons 1950. 1950.
- The Times House of Commons 1955. 1955.
Categories:- Parliamentary constituencies in Devon
- United Kingdom Parliamentary constituencies established in 1832
- United Kingdom Parliamentary constituencies disestablished in 1885
- United Kingdom Parliamentary constituencies established in 1950
- North Devon


Wikimedia Foundation. 2010.