- Cheltenham (UK Parliament constituency)
-
Coordinates: 51°53′24″N 2°04′41″W / 51.890°N 2.078°W
Cheltenham Borough constituency for the House of Commons 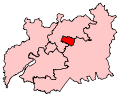
Boundary of Cheltenham in Gloucestershire.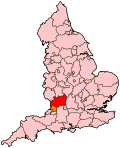
Location of Gloucestershire within England.County Gloucestershire Electorate 77,937 (December 2010)[1] Major settlements Cheltenham Current constituency Created 1832 Member of Parliament Martin Horwood (Liberal Democrat) Number of members One Overlaps European Parliament constituency South West England Cheltenham is a borough constituency represented in the House of Commons of the Parliament of the United Kingdom. It elects one Member of Parliament (MP) by the first-past-the-post system of election.
Contents
Boundaries
The seat covers the town of Cheltenham in Gloucestershire, although with slightly different boundaries to those of Cheltenham borough. It is bordered by the constituencies of Tewkesbury and The Cotswolds.
History
Cheltenham borough constituency was created in the Great Reform Act of 1832 and has returned nine Liberals (or Liberal Democrats) and nine Conservatives to Parliament since that time, along with one independent.
The Conservative Party held the constituency from 1950 until 1992. The Conservatives' campaign in the 1992 general election was marred by a local party member's racist remarks about their candidate, John Taylor, who is of West Indian descent. Taylor subsequently lost the election to Nigel Jones of the Liberal Democrats.
In 2000, Jones was nearly murdered in a horrific incident at one of his MP's surgeries; a man attacked him and an assistant with a samurai sword. His colleague, Andrew Pennington, was killed in the attack. Jones was made a life peer in 2005. The Liberal Democrats held Cheltenham in the 2005 election, with Martin Horwood taking the seat.
Members of Parliament
Elections
Elections in the 2010s
General Election 2010: Cheltenham[3] Party Candidate Votes % ±% Liberal Democrat Martin Horwood 26,659 50.5 +11.1 Conservative Mark Coote 21,739 41.2 +2.4 Labour James Green 2,703 5.1 -6.7 UKIP Peter Bowman 1,192 2.3 +1.0 Monster Raving Loony Dancing Ken Hanks 493 0.9 -0.2 Majority 4,920 9.3 Turnout 52,786 67.0 +6.0 Liberal Democrat hold Swing +4.1 Elections in the 2000s
General Election 2005: Cheltenham Party Candidate Votes % ±% Liberal Democrat Martin Horwood 18,122 41.5 −6.2 Conservative Vanessa Gearson 15,819 36.3 +1.1 Labour Christopher Evans 4,988 11.4 −0.6 Independent Robert Hodges 2,651 6.1 N/A Green Keith Bessant 908 2.1 +0.3 UKIP Niall Warry 608 1.4 +0.2 Monster Raving Loony Dancing Ken Hanks 525 1.2 0.0 Majority 2,303 5.3 Turnout 43,621 61.0 -0.9 Liberal Democrat hold Swing -3.6 General Election 2001: Cheltenham Party Candidate Votes % ±% Liberal Democrat Nigel Jones 19,970 47.7 -1.7 Conservative Rob Garnham 14,715 35.2 -1.1 Labour Andy Erlam 5,041 12.0 +1.9 Green Keith Bessant 735 1.8 N/A Monster Raving Loony Ken Hanks 513 1.2 +0.5 UKIP James Carver 482 1.2 +0.6 ProLife Alliance Anthony Gates 272 0.7 +0.2 Independent Roger Everest 107 0.3 N/A Majority 5,255 12.5 Turnout 41,835 61.9 -12.1 Liberal Democrat hold Swing Elections in the 1990s
General Election 1997: Cheltenham Party Candidate Votes % ±% Liberal Democrat Nigel Jones 24,877 49.45 +2.11 Conservative W Todman 18,232 36.24 -8.50 Labour B Leach 5,100 10.14 +3.78 Referendum Party A Powell 1,065 2.12 Monster Raving Loony K Hanks 375 0.75 UKIP G Cook 302 0.60 ProLife Alliance A Harriss 245 0.49 Natural Law S Brighouse 107 0.21 -0.05 Majority Turnout Liberal Democrat hold Swing General Election 1992: Cheltenham[4] Party Candidate Votes % ±% Liberal Democrat Nigel Jones 30,351 47.3 +5.0 Conservative John Taylor 28,683 44.7 −5.4 Labour Mrs PR Tatlow 4,077 6.4 −1.2 Independent MD Rendell 665 1.0 N/A Natural Law HW Brighouse 169 0.3 N/A Independent MA Bruce-Smith 162 0.3 N/A Majority 1,668 2.6 −5.2 Turnout 64,107 80.3 +1.4 Liberal Democrat gain from Conservative Swing +5.2 Elections in the 1980s
General Election 1987: Cheltenham Party Candidate Votes % ±% Conservative Charles Irving 31,371 50.2 Liberal Richard G Holme 26,475 42.3 Labour M Luker 4,701 7.5 Majority 4,896 7.8 Turnout 78.9 Conservative hold Swing General Election 1983: Cheltenham Party Candidate Votes % ±% Conservative Charles Irving 29,187 50.6 Liberal Richard G Holme 23,669 41.0 Labour Judith James 4,390 7.6 Ecology David G Swindley 479 0.8 Majority 5,518 9.6 Turnout 75.9 Conservative hold Swing Elections in the 1930s
Cheltenham by-election, 1937 Party Candidate Votes % ±% Independent Conservative Daniel Lipson 10,533 40.0 N/A Conservative R. T. Harper 10,194 38.8 −31.7 Labour Cyril Poole 5,570 21.2 −8.3 Majority 339 1.2 Turnout 69.3 −1.1 Independent Conservative gain from Conservative Swing Elections in the 1920s
Cheltenham by-election, 1928 Party Candidate Votes % ±% Conservative Sir Walter Preston 10,438 49.5 −7.1 Liberal Sir John Brunner 6,678 31.7 −11.7 Labour Florence Widdowson 3,962 18.8 N/A Majority 3,760 17.8 +4.6 Turnout 80.3 -2.4 Conservative hold Swing See also
Notes and references
- ^ "Electorate Figures - Boundary Commission for England". 2011 Electorate Figures. Boundary Commission for England. 4 March 2011. http://www.boundarycommissionforengland.org.uk/electoral-figures/electoral-figures.htm. Retrieved 13 March 2011.
- ^ Leigh Rayment's Historical List of MPs – Constituencies beginning with "C" (part 3)
- ^ Acting Returning officer (7 May 2010). "Election Results - Cheltenham Borough Council". Electoral Services. Cheltenham Borough Council. http://www.cheltenham.gov.uk/site/scripts/documents_info.php?documentID=847. Retrieved 14 May 2010.
- ^ "Politics Resources". Election 1992. Politics Resources. 9 April 1992. http://www.politicsresources.net/area/uk/ge92/ge92index.htm. Retrieved 2010-12-06.
Categories:- Parliamentary constituencies in South West England
- United Kingdom Parliamentary constituencies established in 1832
- Politics of Cheltenham


Wikimedia Foundation. 2010.