- Mass spectrum
-
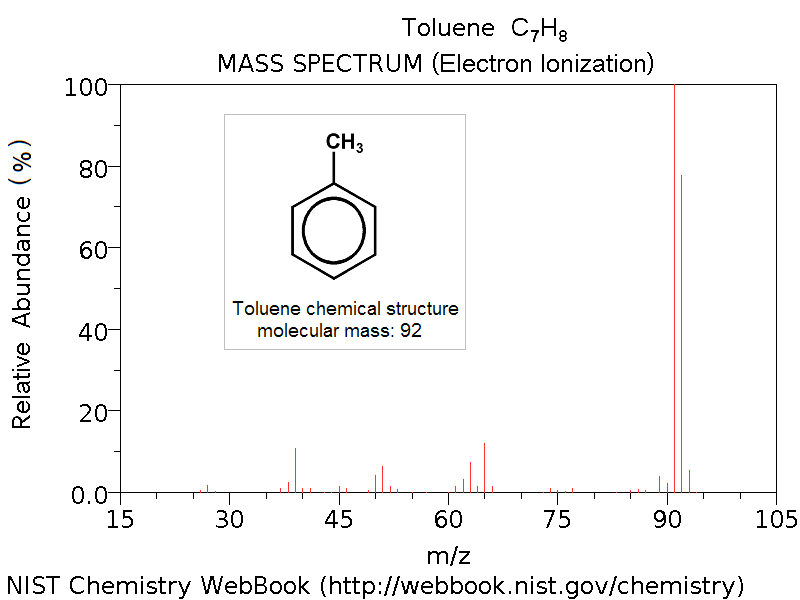
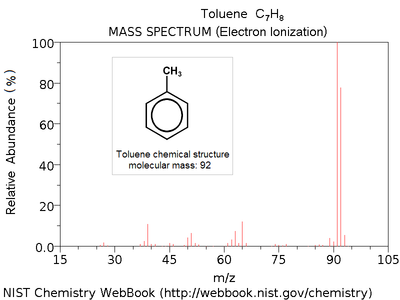 Electron ionization mass spectrum of toluene [4].
Note parent peak corresponding to molecular mass M = 92 (C7H8+) and highest peak at M-1 = 91 (C7H7+, quasi-stable tropylium cation).A mass spectrum is an intensity vs. m/z (mass-to-charge ratio) plot representing a chemical analysis.[1] Hence, the mass spectrum of a sample is a pattern representing the distribution of ions by mass (more correctly: mass-to-charge ratio) in a sample. It is a histogram usually acquired using an instrument called a mass spectrometer. Not all mass spectra of a given substance are the same. For example some mass spectrometers break the analyte molecules into fragments; others observe the intact molecular masses with little fragmentation. A mass spectrum can represent many different types of information based on the type of mass spectrometer and the specific experiment applied; however, all plots of intensity vs. mass-to-charge are referred to as mass spectra. Common fragmentation processes for organic molecules are the McLafferty rearrangement and alpha cleavage.
Contents
X-axis: m/z (mass-to-charge ratio)
The x-axis of a mass spectrum represents a relationship between the mass of a given ion and the number of elementary charges that it carries. This is written as the IUPAC standard m/z to denote the quantity formed by dividing the mass of an ion by the unified atomic mass unit and by its charge number (positive absolute value).[2][3][4] This has been referred to as a mass-to-charge ratio, although in some ways it does not fit this description. The IUPAC Gold Book gives an example[2]: "for the ion C7H72+, m/z equals 45.5".
Since a mass spectrum x-axis represents a relationship between the ion mass and the number of elementary charges that a given ion carries it contains mass information that may be extracted by a knowledgeable mass spectrometrist. Once this is done many mass spectrometrists use dalton (Da) as the unit of mass in order to avoid the clumsy "atomic mass units".
Alternative x-axis notations
There are several alternatives to the standard m/z notation that appear in the literature; however, these are not currently accepted by standards organizations and most journals. m/e appears in older historical literature. A label more consistent with the IUPAC green book and ISO 31 conventions is m/Q or m/q where m is the symbol for mass and Q or q the symbol for charge with the units u/e or Da/e. This notation is not uncommon in the physics of mass spectrometry but is rarely used as the abscissa of a mass spectrum. It was also suggested to introduce a new unit thomson (Th) as a unit of m/z, where 1 Th = 1 u/e.[5] According to this convention, mass spectra x axis could be labeled m/z (Th) and negative ions would have negative values. This notation is rare and not accepted by IUPAC or any other standards organisation.
History of x-axis notation
 Mass spectrum of sodium and potassium positive ions from Arthur Dempster's 1918 publication "A new Method of Positive Ray Analysis " Phys. Rev. 11, 316 (1918)
In 1897 the mass-to-charge ratio m / e of the electron was first measured by J. J. Thomson.[6]. By doing this he showed that the electron, which was postulated before in order to explain electricity, was in fact a particle with a mass and a charge and that its mass-to-charge ratio was much smaller than the one for the hydrogen ion H+. In 1913 he measured the mass-to-charge ratio of ions with an instrument he called a parabola spectrograph.[7] Although this data was not represented as a modern mass spectrum, it was similar in meaning. Eventually there was a change to the notation as m/e giving way to the current standard of m/z.[citation needed]
Early in mass spectrometry research the resolution of mass spectrometers did not allow for accurate mass determination. Francis William Aston won the Nobel prize in Chemistry in 1922.[8] "For his discovery, by means of his mass spectrograph, of isotopes, in a large number of non-radioactive elements, and for his enunciation of the Whole Number Rule." In which he stated that all atoms (including isotopes) follow a whole-number rule [9] This implied that the masses of atoms were not on a scale but could be expressed as integers. (In fact multiply charged ions were rare, so for the most part the ratio was whole as well.) There have been several suggestions (e.g. the unit thomson) to change the official mass spectrometry nomenclature m / z to be more internally consistent.
Y-axis: signal intensity
The y-axis of a mass spectrum represents signal intensity of the ions. When using counting detectors the intensity is often measured in counts per second (cps). When using analog detection electronics the intensity is typically measured in volts. In FTICR and Orbitraps the frequency domain signal (the y-axis) is related to the power (~amplitude squared) of the signal sine wave (often reduced to an rms power); however, the axis is usually not labeled as such for many reasons. In most forms of mass spectrometry, the intensity of ion current measured by the spectrometer does not accurately represent relative abundance, but correlates loosely with it. Therefore it is common to label the y-axis with "arbitrary units".
Y-axis and relative abundance
Signal intensity may be dependent on many factors, especially the nature of the molecules being analyzed and how they ionize. The efficiency of ionization varies from molecule to molecule and from ion source to ion source. For example, in electrospray sources in positive ion mode a quaternary amine will ionize exceptionally well whereas a large hydrophobic alcohol will most likely not be seen no matter how concentrated. In an EI source these molecules will behave very differently. Additionally there may be factors that affect ion transmission disproportionally between ionization and detection.
On the detection side there are many factors that can also affect signal intensity in a non-proportional way. The size of the ion will affect the velocity of impact and with certain detectors the velocity is proportional to the signal output. In other detection systems, such as FTICR, the number of charges on the ion are more important to signal intensity. In Fourier transform ion cyclotron resonance and Orbitrap type mass spectrometers the signal intensity (Y-axis) is related to the amplitude of the free induction decay signal. This is fundamentally a power relationship (amplitude squared) but often computed as an [rms]. For decaying signals the rms is not equal to the average amplitude. Additionally the damping constant (decay rate of the signal in the fid) is not the same for all ions. In order to make conclusions about relative intensity a great deal of knowledge and care is required.
A common way to get more quantitative information out of a mass spectrum is to create a standard curve to compare the sample to. This requires knowing what is to be quantitated ahead of time, having a standard available and designing the experiment specifically for this purpose. A more advanced variation on this the use of an internal standard which behaves very similarly to the analyte. This is often an isotopically labeled version of the analyte. There are forms of mass spectrometry, such as accelerator mass spectrometry that are designed from the bottom up to be quantitative.
See also
- Kendrick mass
References
- ^ IUPAC, Compendium of Chemical Terminology, 2nd ed. (the "Gold Book") (1997). Online corrected version: (2006–) "mass spectrum".
- ^ a b IUPAC, Compendium of Chemical Terminology, 2nd ed. (the "Gold Book") (1997). Online corrected version: (2006–) "mass-to-charge ratio".
- ^ Recommendations for nomenclature and symbolism for mass spectroscopy, International Journal of Mass Spectrometry and Ion Processes Volume 142, Issue 3 , 25 April 1995, Pages 209-240
- ^ Chapter 12: Mass Spectrometry in the IUPAC orange book
- ^ Cooks, R. G. and A. L. Rockwood (1991). "The 'Thomson'. A suggested unit for mass spectroscopists." Rapid Communications in Mass Spectrometry 5(2): 93.
- ^ Philosophical Magazine, 44, 293 (1897)[1]
- ^ Proceedings of the Royal Society A 89, 1-20 (1913)[2]
- ^ http://nobelprize.org/chemistry/laureates/1922/aston-lecture.pdf
- ^ Nature 104, 393 (1919)[3]
External links
- Interactive tutorial on mass spectra National High Magnetic Field Laboratory
- Weighing Atoms: A layperson's introduction to mass spectrometry National High Magnetic Field Laboratory
- What's in an Oil Drop: A layperson's introduction to Fourier Transform Ion Cyclotron Resonance National High Magnetic Field Laboratory
- Quantities, Units and Symbols in Physical Chemistry (IUPAC green book)
- An introductory video on Mass Spectrometry The Royal Society of Chemistry
Mass spectrometry Ion source Mass analyzer Detector MS combination Fragmentation Categories:
Wikimedia Foundation. 2010.