- Crime in London
-
Greater London is served by three police forces; the Metropolitan Police which is responsible for policing the vast majority of the capital and is geographically divided into 32 Borough Operational Command Units, the City of London Police which is responsible for The Square Mile of the City of London, and the British Transport Police which polices the rail network and London Underground.
A fourth police force in London, the Ministry of Defence Police, do not generally become involved with policing the general public. Within the Home Office crime statistic publications Greater London is referred to as the London Region.
Generally, every area in London has different crime rates. Several areas have issues with crime, while many others are very safe.
The City of London and the 32 London boroughs 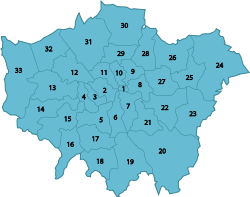

Contents
Crime statistics
Until the late 1990s crime figures for varying crime types were not released to the general public at individual police force level. The annual publication 'Crime in England & Wales' produced by the Home Office began to break the figures down to a smaller area in 1996.[1] Crime figures in England & Wales during the late 1990s and early 2000s were often misinterpreted in the media and scrutinised because of frequent changes in the way crimes were counted and recorded that lead to rises in the crime category 'Violence Against the Person'.[2]
Commenting on figures from 1 April 1998 onwards Jack Straw said "changes in the way crime statistics are compiled are in line with recommendations by senior police officers. They are intended to give a more accurate picture of the level of offences".[3] The largest increases were recorded in the Violence Against the Person category owing to the inclusion of Common assault figures to accompany other offence types within this category that include Assault occasioning actual bodily harm, Grievous bodily harm, Harassment, Murder, possession of offensive weapons and a selection of other low volume violent crimes grouped together by the Metropolitan Police as 'Other Violence'.
The change in counting rules, and the significant impact it had on violence against the person figures, was often misconstrued by the media as real increases. The rises in violence resulting from this were highly publicised on an annual basis.[4][5][6][7][8]
Today crime figures are made available nationally at Local Authority[9] and Ward level.[10] The Metropolitan Police have made detailed crime figures, broken down by category at borough and ward level, available on their website for the last 10 years.[11]
Counting rules
A detailed breakdown of the way crimes are counted are available from the Home Office website.[12] Recorded crime increased in England and Wales during most of the 1980s, reaching a peak in 1992, and then fell each year until 1998/99 when the changes in the Counting Rules resulted in an increase in recorded offences. This was followed by the introduction of the National Crime Recording Standard (NCRS)[13] in April 2002 which led to a rise in recording in 2002/03 and 2003/04, as the rules bedded-in within forces. Up until 1998 crime figures were collected to cover a Calendar year however this changed from 1998 when crime statistics began to be collated and grouped by Financial Year.
Violent crime
Crimes categorised as 'Violent Crime' by the Home Office are violence against the person,[2] robbery and sexual offences.
Homicide
Since 1990 there has been an average of 171 homicides committed each year across the 32 BOCUs in London. During this period the lowest annual figure was 139 in 1996 and the highest being 204 in the financial year 2003/04. Between 2003/04 and 2008/09 the number of annual homicides decreased by 27% from 204 to 148.
Crime rate 1990 1991 1992 1993 1994 1995 1996 1997 1998 1999 2000-01 2001-02 2002-03 2003-04 2004-05 2005-06 2006-07 2007-08 2008-09 2009-10 Homicide total 184 184 175 160 169 167 139 190 159 146 171 190 189 204 182 168 162 156 148 136 Homicide rate 2.5 2.5 2.3 2.1 2.3 2.2 1.9 2.5 2.1 1.9 2.3 2.5 2.5 2.7 2.4 2.2 2.2 2.1 2.0 1.9 Sources: International Comparison of CJS Statistics 1998,[14] Metropolitan Police Performance Information,[15] Metropolitan Police Crime Mapping Data Tables[16]
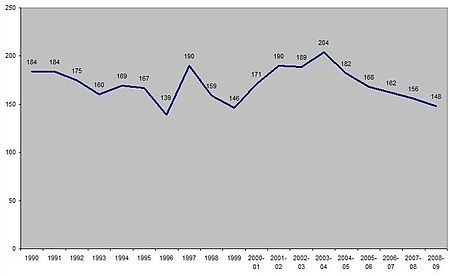 London Homicides (1990-2009)
.[17][18][19][20][21][22][23][24][25]
The distribution of homicide offences in London can vary significantly by borough. Between 2000/01 and 2008/09 there were 1,570 offences committed in London. This ranged from 123 in the London Borough of Lambeth to just 12 in Kingston upon Thames.
Rank Borough Number of homicides 2000/01 to 2008/09 1 Lambeth 123 2 Southwark 96 3 Newham 95 4 Hackney 94 5 Brent 77 6 Camden 75 7 Haringey 72 8 Croydon 63 9 Ealing 63 10 Tower Hamlets 56 11 Waltham Forest 54 12 Enfield 53 13 Greenwich 53 14 Islington 53 15 Lewisham 53 16 Westminster 53 17 Wandsworth 46 18 Redbridge 41 19 Hammersmith and Fulham 37 20 Barnet 36 21 Hounslow 36 22 Barking & Dagenham 35 23 Hillingdon 31 24 Bromley 29 25 Havering 24 26 Merton 24 27 Kensington & Chelsea 22 28 Bexley 18 29 Sutton 17 30 Harrow 16 31 Richmond upon Thames 13 32 Kingston upon Thames 12 Measuring violent crime by borough made a perceived link between social disadvantage and crime, but borough perceptions have become incorrect and misinformed. The borough of Camden for example, contains some of the most prosperous areas on the planet, but also some with very high poverty levels - leading to a misconception of the borough by many people.
Assault with injury
Assault with injury, currently compromised of Assault occasioning actual bodily harm and Grievous bodily harm by the Metropolitan Police, accounts for on average 40% of all violence against the person offences within the Metropolitan Police area and 45% of all violence against the person nationally.[26] In England and Wales 'assault without injury' and harassment account for a further 38% of crimes recorded within the violence against the person category.
In 2008/09 there 70,962 assault with injury offences in London with a rate of 9.5 per 1,000 residents.[27] This was slightly higher than the total rate for England and Wales, which was 7.0 per 1,000 residents.[28]
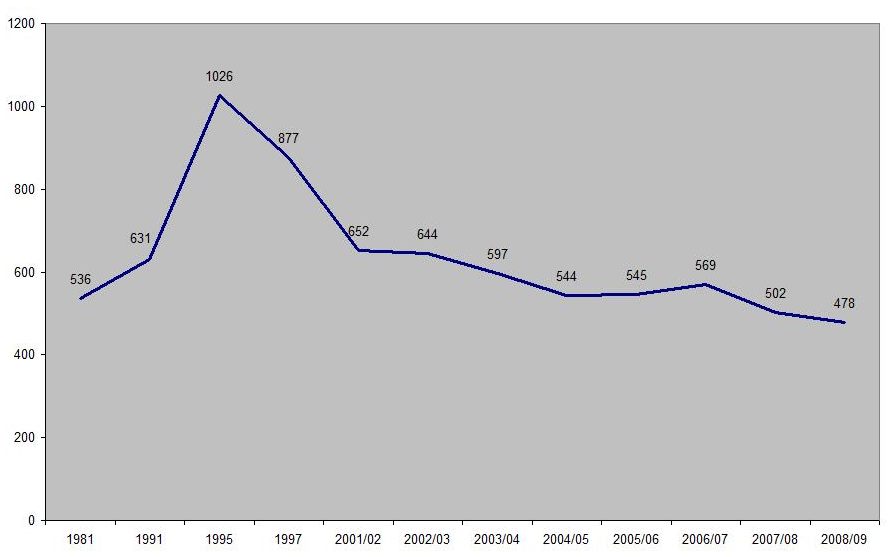
 British Crime Survey Violence Rates (1981-2009)
Crime rate 2000-01 2001-02 2002-03 2003-04 2004-05 2005-06 2006-07 2007-08 2008-09 ABH and GBH rate per 1,000 London 5.6 5.6 5.6 5.8 9.4 11.2 10.4 9.5 9.5 ABH and GBH rate per 1,000 England & Wales 3.6 3.8 6.2 7.6 8.6 9.0 8.4 7.5 7.0 Sources: Metropolitan Police Crime Mapping Data Tables,[16] Crime in England & Wales 2008/09[29]
Following the changes introduced by the National Crime Recording Standard (NCRS) in 2002 the way assaults were categorised was dependent on injury therefore there was a significant jump in combined ABH and GBH nationally in 2002/03. Prior to NCRS minor injuries were counted as common assault although post NCRS any assault with injury would be categorised as ABH. Therefore looking at figures over time is of limited value as figures prior to 2002/03 are not comparable with the way certain violent crimes have been recorded since then. These changes were not reflected in the Metropolitan Police performance figures until 2004/05 when the rate almost doubled to 9.4 per 1,000 residents compared to 5.8 the previous year. In 2005/06 the rate of recorded ABH and GBH peaked both nationally and within the Metropolitan Police force area according to recorded statistics.
The British Crime Survey or BCS is a systematic victim study, currently carried out by BMRB Limited on behalf of the Home Office. The BCS seeks to measure the amount of crime in England and Wales by asking around 50,000 people aged 16 and over, living in private households, about the crimes they have experienced in the last year. The survey is comparable to the National Crime Victimization Survey conducted in the United States. The Home Office estimated that just 37% of violence with injury offences were reported to and recorded by police.
An advantage of the BCS is that it has not been affected by the changes in counting rules and the way crime is categorised because it is survey based. This makes it possible to observe national trends in crime over time. Crime in England & Wales 2008/09,[30] shows BCS violence with injury to have peaked in 1995 and declined steadily since then. Between 1995 and 2008/09 the BCS estimates that violence with injury offences decreased 53.6% across England & Wales.
Gun and knife crime
Weapon enabled crimes are recorded by the Metropolitan Police when a weapon is used to assist a crime, e.g. a knife or gun enabled robbery. Recorded gun and knife enabled offences in London account for about 2% of total recorded crime. London Boroughs with the highest rates of gun and knife crime include Newham, Southwark, Hackney, Islington, Waltham Forest and Lambeth.[31] Gun enabled crime figures are displayed on the Metropolitan Police website at borough level expressed as financial year to date comparisons[32] but they are seldom made available for historical comparisons. Figures are available for calendar years 2000 to 2007[33] as shown in the table below.
Crime rate 1999 2000 2001 2002 2003 2004 2005 2006 2007 2008 2009 Gun enabled crime 2961 3250 4005 4444 4025 3744 3881 3327 3459 2525 3295 Rate per 10,000 London 3.9 4.3 5.3 5.9 5.4 4.9 5.2 4.4 4.6 3.4 4.4 Sources: Metropolitan Police Crime Summary 2007,[34] Metropolitan Police Interactive Crime Figures[32]
Since 2000 there has been consistent fluctuations in the number of gun enabled recorded by the Metropolitan Police which peaked in 2003 when there were 4,444 recorded offences. The lowest number of offences recorded was potentially in 2008 where there were just 1,980 gun enabled crimes between December 2007 and November 2008, an unusually low figure in comparison to other years. Since then however gun enabled crime has increased 67% across London with 3,309 offences being recorded in the 12 months to November 2009.
Crime rate 2003 2004 2005 2006 2007 2008-09 2009-10 Knife enabled crime 10305 12985 12367 12301 10699 12345 12611 Rate per 10,000 London 13.7 17.3 16.5 16.4 14.3 16.4 16.8 Sources: Metropolitan Police Crime Summary 2007[34]
Knife enabled crime figures are available from 2003 to 2007 and more recently monthly knife crime summaries are provided on the Metropolitan Police website showing financial year to date figures.[35] Knife enabled offences increased from 2003 to 2004 and from then on saw annual reductions until 2007. It was not possible to retrieve statistics for 2008 and 2009.
The Metropolitan Police a number of operations that concentrate on knife and gun crime. They include Operation Trident and Trafalgar which deal with fatal and non-fatal shootings across London, Operation Blunt which was initially launched across 12 boroughs in 2004 to tackle knife crime and subsequently rolled out across the forces 32 boroughs in 2005 after early successes.[36] Operation Blunt was re-launched as Operation Blunt II in 2008 with the aim of tackling serious youth violence.[37] In addition to this there is the Specialist Firearms Command formerly known as SO19.
Robbery
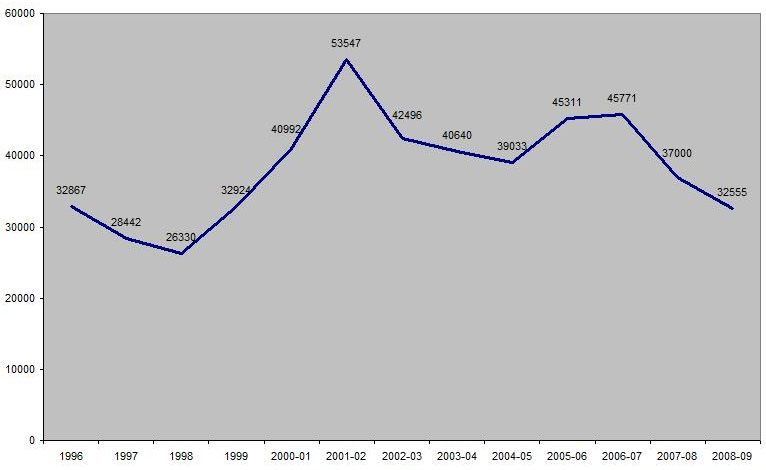
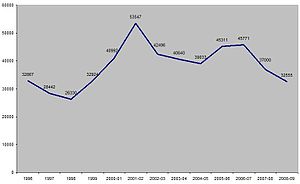 London Robbery Offences (1996-2009)
Recording of robbery offences in England and Wales are sub-divided into Business Robbery (robbery of a business, i.e. a bank robbery) and Personal Robbery (taking an individuals personal belongings with force/threat).[38] Annually business robbery offences in London account for on average 10% of total robbery offences.
Crime Rate 1996 1997 1998 1999 2000-01 2001-02 2002-03 2003-04 2004-05 2005-06 2006-07 2007-08 2008-09 2009-10 London Robbery Offences 32867 28442 26330 32924 40992 53547 42496 40640 39033 45311 45771 37000 32555 33463 Rate per 1,000 London 4.4 3.8 3.5 4.4 5.5 7.1 5.7 5.4 5.2 6.0 6.1 4.9 4.3 4.5 Sources: Metropolitan Police Crime Data Tables (2000-01 to 2008-09 data),[39] Crime in England and Wales Series (1996-1999 data)[40][41][42]
Robbery offending across London fell almost 20% between 1996 and 1998 from 32,867 to 26,330 offences. Following changes in counting rules of crimes and the later introduction of the National Crime Recording Standard offences of robbery rose both nationally and within London.[43] In London offences increased by 25% in 1999 compared with 1998. There was a 25% increase between 1999 and 2000/01 and a further 30% increase between 2000/01 and 2001/02 when the robbery rate in London peaked to 7.1 offences per 1,000 population. In March 2002 the government launched the 'Street Crime Initiative' with the aim of reducing robbery in the most affected police forces, including the Metropolitan Police. Nationally the 'Street Crime Initiative' achieved a reduction in robbery of 32% by March 2005.[44] In London during the same period robbery reduced by 27% from 53,547 in 2001/02 to 39,033 in 2004/05. After the initiative had finished robbery offences increased and stayed at a rate of around 6.0 per 1,000 for the next two financial years, however, there has now been a steady annual decline in robbery rates across London since 2006/07.
The increases in robbery were largely attributed to the rise in youth on youth robberies across London with particular focus around schools and transport interchanges and increased usage and ownership of items such as mobile phones, one of the most commonly stolen items. The increases that followed the end of the street crime initiative were thought somewhat to be a result of the increased mobility of young people when the introduction of oyster cards to provide under-16s free travel on London's transport network was introduced.[45]
Race and crime
Further information: Race and crime in the United KingdomIn June 2010 The Sunday Telegraph, through a Freedom of Information Act request, obtained statistics on accusations of crime broken down by race from the Metropolitan Police Service.[n 1] The figures showed that the majority of males who were accused of violent and sexual crimes (including those subsequently acquitted) in 2009–10 were black. Of the recorded 18,091 such accusations against males, 54 percent accused of street crimes were black; for robbery, 59 percent; for gun crimes, 67 percent; and for sexual offences, 32 percent.[46]
Street crimes include muggings, assault with intent to rob, and snatching property.. Black males accounted for 29 percent of the male victims of gun crime and 24 percent of the male victims of knife crime.[46] Similar statistics were recorded for females. On knife crime, 45 percent of suspected female perpetrators were black; for gun crime, 58 percent; and for robberies, 52 percent.[47]
Operation Trident was set up in March 1998 by the Metropolitan Police to investigate gun crime in London's black community after black-on-black shootings in Lambeth and Brent.[48]
Between April 2005 and January 2006, figures from the Metropolitan Police Service showed that black people accounted for 46 percent of car-crime arrests generated by automatic number plate recognition cameras.[49]
Metropolitan force comparisons
Below are crime rate comparisons for London and the metropolitan districts of England in 2007/08 financial year.
Offences (per 1,000 of population, except homicides and firearm offences, per 100,000) Police force Main city Homicides Firearms offences Violence against
the personSexual offences Robbery Burglary (residential) Theft of and from
motor vehiclesLondon Region London 2.2 45.3 23.2 1.2 4.9 8.0 16.0 Greater Manchester Manchester 1.9 44.6 19.3 1.2 2.9 8.3 16.7 West Midlands Birmingham 1.6 37.5 20.5 1.2 2.9 6.9 13.1 Merseyside Liverpool 2.3 29.5 15.4 0.7 1.2 6.2 10.7 South Yorkshire Sheffield 2.1 15.0 18.1 0.9 1.0 6.6 15.4 West Yorkshire Leeds 2.1 15.1 17.7 1.0 1.4 8.5 13.2 Northumbria Newcastle 2.1 5.6 13.9 0.8 0.6 3.6 8.1 England London 1.4 18.9 17.5 1.0 1.6 5.2 11.1 Sources: Homicide, Firearms Offences and Intimate Violence 2007/08,[50] Crime in England & Wales 2007/08[51]
See also
Footnotes
- ^ The figures relate to those 'proceeded against', including those prosecuted in court, whether convicted or acquitted; those issued with a caution, warning or penalty notice; those the Crown Prosecution Service decided not to charge; and those whose crimes were 'taken into consideration' after a further offence.[46]
References
- ^ Notifiable Offences England and Wales 1996
- ^ a b Home Office Counting Rules: Violence Against the Person
- ^ BBC News 25/08/99 Counting System to Increase Crime Figures
- ^ BBC 18/07/00 Violent Crime Figures Not Accurate
- ^ BBC 19/07/01 Violent Crime on the rise
- ^ BBC 17/07/03 Crime figures paint confusing picture
- ^ BBC 22/01/04 Violent crime up by 14%
- ^ BBC 21/04/05 Violent Crime Rise Sparks Row
- ^ Home Office Interactive Crime Atlas
- ^ National Policing Improvement Agency: Local Crime Mapping
- ^ Metropolitan Police Crime Mapping Data Tables
- ^ Home Office Counting Rules for Recorded Crime
- ^ Home Office National Crime Recording Standard: An analysis of the impact on recorded crime
- ^ Home Office International Comparison of CJS Statistics 1998
- ^ Metropolitan Police Performance Information
- ^ a b MPS Crime Mapping Data Tables
- ^ MPS Borough Level Crime Figures 2000/01
- ^ MPS Borough Level Crime Figures 2001/02
- ^ MPS Borough Level Crime Figures 2002/03
- ^ MPS Borough Level Crime Figures 2003/04
- ^ MPS Borough Level Crime Figures 2004/05
- ^ MPS Borough Level Crime Figures 2005/06
- ^ MPS Borough Level Crime Figures 2006/07
- ^ MPS Borough Level Crime Figures 2007/08
- ^ MPS Borough Level Crime Figures 2008/09
- ^ Crime in England and Wales 2008/09
- ^ MPS Monthly Crime Totals
- ^ Home Office: Crime in England and Wales 2008/09, p.30
- ^ Home Office: Crime in England and Wales 2008/09, p/30
- ^ Home Office: Crime in England and Wales 2008/09, p.28
- ^ Gun and knife enabled crime in London
- ^ a b Interactive Crime Figures accessed 10.01.10
- ^ Crime Summary 2007
- ^ a b Crime Summary 2007, p.2
- ^ MPS Monthly Knife Crime Summary, November 2009
- ^ Tackling Knife Crime: Operation Blunt
- ^ More than 500 knives seized in Blunt 2
- ^ Home Office Counting Rules: Robbery
- ^ MPS Crime Data Tables
- ^ Notifiable Offences, England & Wales 1996
- ^ Notifiable Offences, England & Wales 1997
- ^ Recorded Crime in England & Wales 1998-99
- ^ BBC Street Crime Surges 18.01.00
- ^ Home Office: Tackling Robbery, practical lessons from the street crime initiative
- ^ Government Office for London: Personal Robbery Project 2007
- ^ a b c Alderson, Andrew. "Violent inner-city crime, the figures, and a question of race". The Daily Telegraph. 26 June 2010. Retrieved 23 September 2010.
- ^ Camber, Rebecca. "Black men 'to blame for most violent city crime'... but they're also the victims". Daily Mail. 27 June 2010. Retrieved 23 September 2010.
- ^ "Q&A: Operation Trident". BBC News. 14 September 2006. Retrieved 26 September 2010.
- ^ Gadher, Dipesh. "Cameras set racial poser on car crime". The Times. 14 May 2006. Retrieved 27 September 2010.
- ^ Home Office Homicide, Firearms Offences and Intimate Violence 2007/08
- ^ Home Office: Crime in England & Wales 2007/08
Further information
- Home Office Interactive Maps of Local Authority Crime Data
- Metropolitan Police Crime Mapping Data Tables
- Metropolitan Police Crime Mapping Site
- Metropolitan Police Current Crime Data By Borough
External links
- www.crime-statistics.co.uk UK / London Crime Statistics and Crime Statistic Comparisons
- Government Office for London Data & Analytical Tools
- Greater London Domestic Violence Project
- Home Office Anti-Social Behaviour Action Website
- Home Office Crime Reduction Website
- Home Office Statistical Publications Archive
- Knife City - Carrying a knife. Its not a game
- London Against Gun and Knife Crime
- London Serious Youth Violence Board
- Metropolitan Police Operation Bumblebee Burglary Prevention Scheme
- Metropolitan Police Publication Scheme
- National Policing Improvement Agency Local Crime Mapping
- Operation Trident: Stop the Guns
- Youth Offending Service Statistics
Categories:


Wikimedia Foundation. 2010.