- Coal by country
-
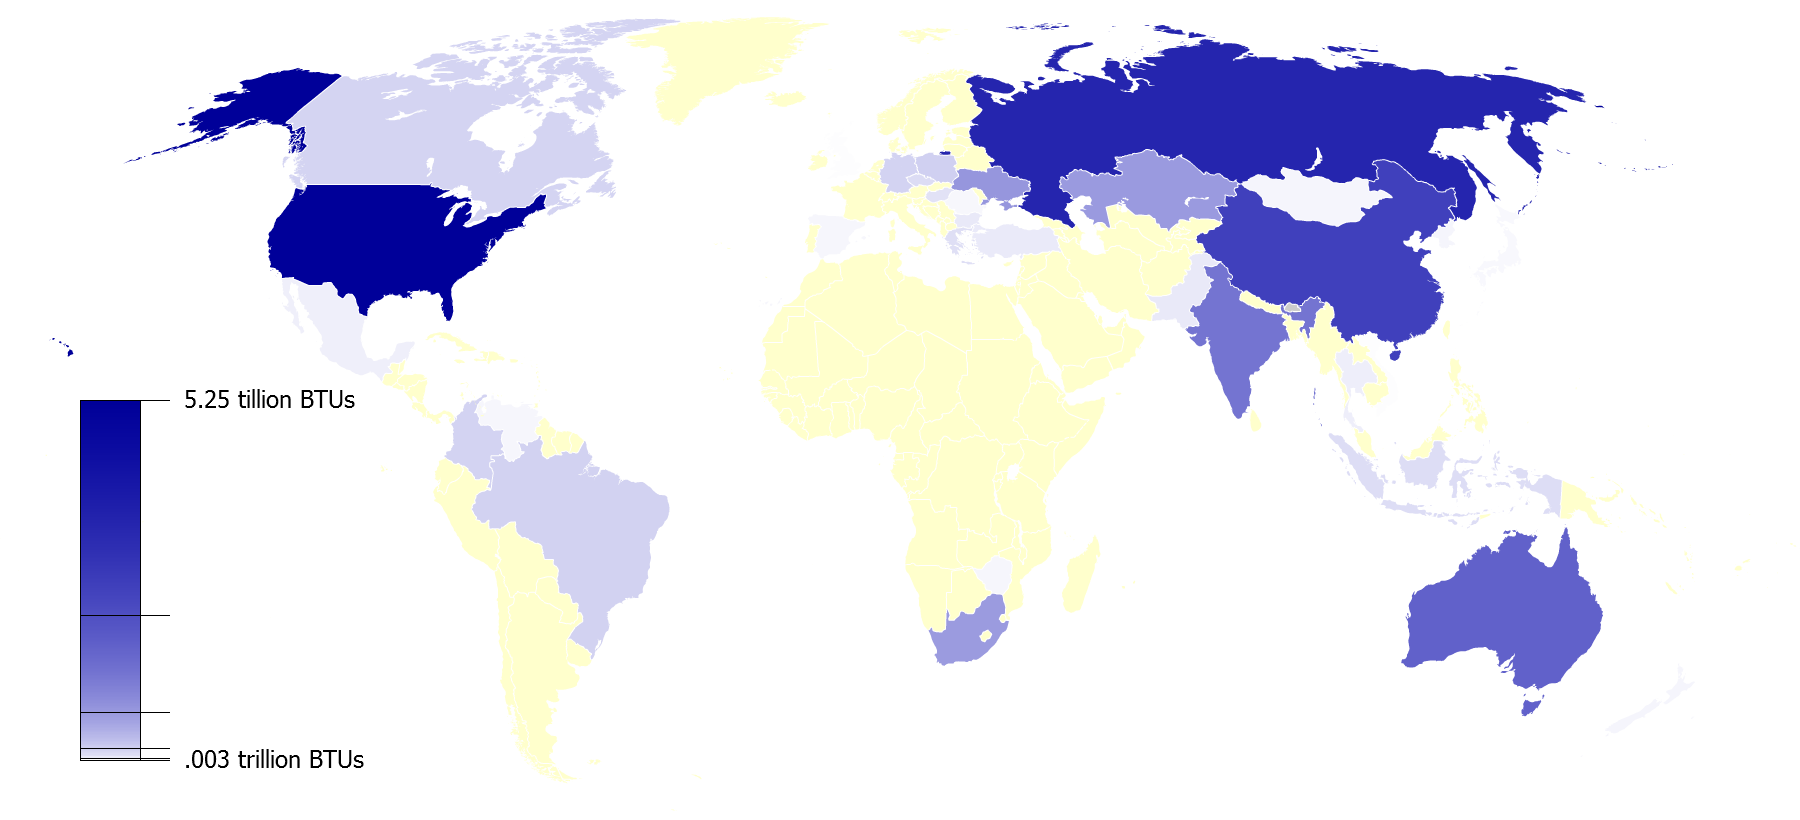
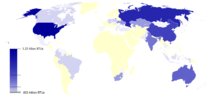 Coal reserves in BTUs as of 2009
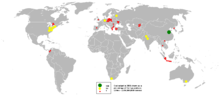 Coal output in 2005
This article includes lists representing proven reserves and production of coal by country. All data is taken from British Petroleum.
The reserve list specifies different types of coal and includes countries with at least 0.1% share of estimated world coal reserves.
The production list includes countries with coal production close to or larger than 1 million tonnes.
See also separate lists:
Proved recoverable coal reserves at end-2006
(million tonnes)[1]Coal production in 2007
(million tonnes)[2]Rank Country Bituminous & anthracite SubBituminous & lignite Total Share 1  USA
USA111,338 135,305 246,643 27.1 2  Russia
49,088 107,922 157,010 17.3 3  China
China62,200 52,300 114,500 12.6 4  India
India90,085 2,360 92,445 10.2 5  Australia
38,600 39,900 78,500 8.6 6  South Africa
48,750 0 48,750 5.4 7  Ukraine
16,274 17,879 34,153 3.8 8  Kazakhstan
28,151 3,128 31,279 3.4 9  Poland
14,000 0 14,000 1.5 10  Brazil
0 10,113 10,113 1.1 11  Germany
183 6,556 6,739 0.7 12  Colombia
6,230 381 6,611 0.7 13  Canada
3,471 3,107 6,578 0.7 14  Czech Republic
2,094 3,458 5,552 0.6 15  Indonesia
740 4,228 4,968 0.5 16  Turkey
278 3,908 4,186 0.5 17  Greece
0 3,900 3,900 0.4 18  Hungary
198 3,159 3,357 0.4 19  Pakistan
0 3,300 3,300 0.3 20  Bulgaria
4 2,183 2,187 0.2 21  Thailand
0 1,354 1,354 0.1 22  North Korea
300 300 600 0.1 23  New Zealand
33 538 571 0.1 24  Spain
Spain200 330 530 0.1 25  Zimbabwe
502 0 502 0.1 26  Romania
22 472 494 0.1 27  Venezuela
479 0 479 0.1 TOTAL 478,771 430,293 909,064 100.0 - Recent discoveries in the Thar region of Pakistan have given rise to a discovery of nearly 185 billion tonnes. [1]
Rank Country Production Share World 6,395.6 100 1 China2,536.7 39.7 2 USA1,039.2 16.2  EU
EU590.5 9.2 3 India478.2 7.5 4 Australia393.9 6.2 5 Russia314.2 4.9 6 South Africa269.4 4.2 7 Germany201.9 3.2 8 Indonesia174.8 2.7 9 Poland145.8 2.3 10 Kazakhstan94.4 1.5 11 Turkey76.6 1.2 12 Ukraine76.3 1.2 13 Colombia71.7 1.1 14 Canada69.4 1.1 15 Czech Republic62.6 1.0 16 Greece62.5 1.0 17  Vietnam
41.2 0.6 18 Romania35.4 0.6 19 Bulgaria30.4 0.5 20 Thailand18.3 0.3 21 Spain18.2 0.3 22  United Kingdom
17.0 0.3 23  Mexico
12.2 0.2 24 Hungary9.8 0.2 25 Venezuela8.0 0.1 26 Brazil5.9 0.1 27 New Zealand4.6 0.1 28 Pakistan3.6 0.1 28 Zimbabwe3.3 29  South Korea
3.2 31  Japan
Japan1.3 32  France
0.9 References
- ^ "BP Statistical review of world energy June 2007" (XLS). British Petroleum. June 2007. http://www.bp.com/liveassets/bp_internet/globalbp/globalbp_uk_english/reports_and_publications/statistical_energy_review_2007/STAGING/local_assets/downloads/spreadsheets/statistical_review_full_report_workbook_2007.xls. Retrieved 2007-10-22.
- ^ "Statistical Review of World Energy 2008". British Petroleum. http://www.bp.com/productlanding.do?categoryId=6929&contentId=7044622.
Lists of countries by energy rankings Oil Natural gas Coal Nuclear power Renewable energy Electric energy Total energy Lists by country · List of international rankings · List of top international rankings by country Categories:- Coal by country
- Lists of countries
- Economics lists by country

Wikimedia Foundation. 2010.