- Mole Valley (UK Parliament constituency)
-
Coordinates: 51°15′58″N 0°19′41″W / 51.266°N 0.328°W
Mole Valley County constituency for the House of Commons 
Boundary of Mole Valley in Surrey.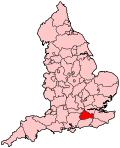
Location of Surrey within England.County Surrey Electorate 72,568 (December 2010)[1] Major settlements Dorking, Leatherhead Current constituency Created 1983 Member of Parliament Sir Paul Beresford (Conservative) Number of members One Created from Dorking Overlaps European Parliament constituency South East England Mole Valley is a county constituency represented in the House of Commons of the Parliament of the United Kingdom. It elects one Member of Parliament (MP) by the first past the post system of election.
Contents
Boundaries
The constituency covers much the same area as that covered by the Mole Valley district in Surrey, though it includes five wards in the east of the Borough of Guildford. The largest town in the constituency is Dorking, and the constituency also contains the town of Leatherhead, as well as many rural and satellite villages.
Mole Valley underwent minor boundary changes before the 2010 general election to match local government ward boundaries, but these moved no voters.
History
The constituency was created in 1983; much of the same area was covered by the Dorking constituency which preceded it. It is a safe Conservative seat, and has a reputation as being one of the safest places to live in Britain, with its affluent middle-class commuter towns and villages for the vast London metropolis, returning a Tory with over a 10,000 majority even in the 1997 Labour landslide.
Members of Parliament
Election Member [2] Party 1983 Kenneth Baker Conservative 1997 Sir Paul Beresford Conservative Elections
Elections in the 2010s
General Election 2010: Mole Valley Party Candidate Votes % ±% Conservative Sir Paul Beresford 31,263 57.5 +2.8 Liberal Democrat Alice Humphreys 15,610 28.7 -1.7 Labour James Dove 3,804 7.0 -3.7 UKIP Leigh Jones 2,752 5.1 +2.1 Green Rob Sedgwick 895 1.6 +1.6 Majority 15,653 28.8 Turnout 54,324 74.8 +3.4 Conservative hold Swing +2.3 Elections in the 2000s
General Election 2005: Mole Valley Party Candidate Votes % ±% Conservative Sir Paul Beresford 27,060 54.8 +4.3 Liberal Democrat Nasser Butt 15,063 30.5 +1.5 Labour Farmida Bi 5,310 10.7 -5.9 UKIP David Payne 1,475 3.0 +0.2 Veritas Roger Meekins 507 1.0 N/A Majority 11,997 24.3 Turnout 49,415 72.5 +3.6 Conservative hold Swing +1.4 General Election 2001: Mole Valley Party Candidate Votes % ±% Conservative Sir Paul Beresford 23,790 50.5 +2.5 Liberal Democrat Celia Savage 13,637 29.0 -0.3 Labour Dan Redford 7,837 16.6 +1.9 UKIP Ron Walters 1,333 2.8 +2.0 ProLife Alliance William Newton 475 1.0 N/A Majority 10,153 21.5 Turnout 47,072 68.9 -9.5 Conservative hold Swing +1.4 Elections in the 1990s
This constituency underwent boundary changes between the 1992 and 1997 general elections and thus change in share of vote is based on a notional calculation.
General Election 1997: Mole Valley Party Candidate Votes % ±% Conservative Sir Paul Beresford 26,178 48.0 -13.3 Liberal Democrat Stephen Cooksey 15,957 29.3 +0.6 Labour Christopher Payne 8,057 14.8 +5.4 Referendum Party Nick Taber 2,424 4.4 N/A Independent Conservative Richard Burley 1,276 2.3 N/A UKIP Ian Cameron 435 0.8 N/A Natural Law Judith Thomas 197 0.4 -0.4 Majority 10,221 18.7 Turnout 54,524 78.4 -3.6 Conservative hold Swing -6.9 General Election 1992: Mole Valley[3] Party Candidate Votes % ±% Conservative Kenneth Baker 32,549 59.3 -1.5 Liberal Democrat Michael Watson 16,599 30.3 +0.4 Labour Dr Tim Walsh 5,291 9.6 +0.3 Natural Law Judith Thomas 442 0.8 N/A Majority 15,950 29.0 −1.9 Turnout 54,881 82.0 +5.0 Conservative hold Swing -0.9 Elections in the 1980s
General Election 1987: Mole Valley Party Candidate Votes % ±% Conservative Kenneth Baker 31,689 60.8 0.0 Liberal S. P. Thomas 15,613 29.9 -0.8 Labour C. M. B. King 4,846 9.3 +0.8 Majority 16,076 30.9 Turnout 52,148 77.0 +2.0 Conservative hold Swing +0.4 General Election 1983: Mole Valley Party Candidate Votes % ±% Conservative Kenneth Baker 29,691 60.8 Liberal S. P. Thomas 14,973 30.7 Labour Fanny Lines 4,147 8.5 Majority 14,718 30.1 Turnout 48,811 75.0 Conservative hold Swing See also
Notes and references
- ^ "Electorate Figures - Boundary Commission for England". 2011 Electorate Figures. Boundary Commission for England. 4 March 2011. http://www.boundarycommissionforengland.org.uk/electoral-figures/electoral-figures.htm. Retrieved 13 March 2011.
- ^ Leigh Rayment's Historical List of MPs – Constituencies beginning with "M" (part 3)
- ^ "Politics Resources". Election 1992. Politics Resources. 9 April 1992. http://www.politicsresources.net/area/uk/ge92/ge92index.htm. Retrieved 6 Dec 2010.
Sources
- Election result, 2010 (BBC)
- Election result, 2005 (BBC)
- Election results, 1997 - 2001 (BBC)
- Election results, 1997 - 2001 (Election Demon)
- Election results, 1983 - 1992 (Election Demon)
- Election results, 1992 - 2010 (Guardian)
- Election result, 2010 (UKPollingReport)
External links
Categories:- Parliamentary constituencies in South East England
- Politics of Surrey
- United Kingdom Parliamentary constituencies established in 1983
- Mole Valley


Wikimedia Foundation. 2010.