- Ashford (UK Parliament constituency)
-
Ashford County constituency for the House of Commons 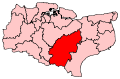
Boundary of Ashford in Kent for the 2010 general election.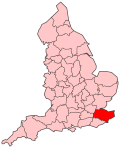
Location of Kent within England.County Kent Electorate 81,947 (December 2010)[1] Current constituency Created 1885 Member of Parliament Damian Green (Conservative) Number of members One Created from West Kent Overlaps European Parliament constituency South East England Ashford is a parliamentary constituency represented in the House of Commons of the Parliament of the United Kingdom. It elects one Member of Parliament (MP) by the first past the post voting system.
Contents
Boundaries
Ashford constituency has the same boundaries as Ashford borough. It comprises the rapidly expanding town of Ashford together with the smaller town of Tenterden and 35 villages.
Boundary review
Following their review of parliamentary representation in Kent, the Boundary Commission for England made major changes to the existing constituencies as a consequence of population expansion across the county. These changes took effect at the 2010 general election.
The electoral wards used in the modified Ashford constituency are entirely within the borough of Ashford;
- Aylesford Green, Beaver, Biddenden, Bockhanger, Boughton Aluph and Eastwell, Bybrook, Charing, Downs North, Downs West, Godinton, Great Chart with Singleton North, Highfield, Isle of Oxney, Kennington, Little Burton Farm, Norman, North Willesborough, Park Farm North, Park Farm South, Rolvenden and Tenterden West, St Michaels, Singleton South, South Willesborough, Stanhope, Stour, Tenterden North, Tenterden South, Victoria, Washford, Weald Central, Weald East, Weald North, Weald South and Wye
Members of Parliament
- Constituency created (1885)
Election Member[2] Party 1885 William Pomfret Pomfret Conservative 1892 Laurence Hardy Conservative 1918 Samuel Strang Steel Coalition Conservative 1929 Rev. Roderick Kedward Liberal 1931 Michael Knatchbull Conservative 1933 by-election Patrick Spens Conservative 1943 by-election Edward Percy Smith Conservative 1950 Bill Deedes Conservative 1974 Keith Speed Conservative 1997 Damian Green Conservative Elections
Elections in the 2010s
General Election 2010: Ashford [1] Party Candidate Votes % ±% Conservative Damian Green 29,878 54.1 +2.7 Liberal Democrat Chris Took 12,581 22.8 +7.2 Labour Chris Clark 9,204 16.7 -9.7 UKIP Jeffrey Elenor[3] 2,508 4.5 +1.4 Green Steven Campkin 1,014 1.8 -1.6 Majority 17,297 31.3 Turnout 55,185 67.9 +2.5 Conservative hold Swing +2.3 Elections in the 2000s
General Election 2005: Ashford Party Candidate Votes % ±% Conservative Damian Green 26,651 51.6 +4.2 Labour Valerie Whitaker 13,353 25.8 −6.3 Liberal Democrat Chris Took 8,308 16.1 +1.0 Green Richard Boden 1,753 3.4 +0.6 UKIP Bernard Stroud 1,620 3.1 +0.5 Majority 13,298 25.7 +10.4 Turnout 51,685 65.0 +2.5 Conservative hold Swing +5.2 General Election, 2001: Ashford Party Candidate Votes % ±% Conservative Damian Green 22,739 47.4 +6.0 Labour John Adams 15,380 32.1 +0.4 Liberal Democrat Kieth Fitchett 7,236 15.1 −4.6 Green Richard Boden 1,353 2.8 +1.6 UKIP David Waller 1,229 2.6 N/A Majority 7,359 15.3 +5.6 Turnout 47,937 62.5 −11.7 Conservative hold Swing +3.2 Elections in the 1990s
General Election 1997: Ashford[4][5] Party Candidate Votes % ±% Conservative Damian Green 22,899 41.4 −13.2 Labour J Ennals 17,554 31.7 +11.7 Liberal Democrat J Williams 10,901 19.7 −4.4 Referendum Party C Cruden 3,201 5.8 N/A Green R Boden 660 1.2 −0.2 Natural Law S Tyrell 89 0.2 N/A Majority 5,345 9.7 −20.8 Turnout 55,302 74.2 −5.0 Conservative hold Swing −12.5 General Election 1992: Ashford[6] Party Candidate Votes % ±% Conservative Keith Speed 31,031 54.6 −1.9 Liberal Democrat Ms. CLB Headley 13,672 24.1 −3.3 Labour Ms. DA Cameron 11,365 20.0 +5.3 Green Dr. CA Porter 773 1.4 −0.1 Majority 17,359 30.5 +1.3 Turnout 56,841 79.2 +3.5 Conservative hold Swing +0.7 Elections in the 1940s
General Election 1945: Ashford Party Candidate Votes % ±% Conservative E P Smith 18,800 51.96% Labour H W Lee 12,575 34.76% Liberal H V Strong 4,804 13.28% Majority 6,225 17.21% Turnout 71.27 Conservative hold Swing See also
Notes and references
- ^ "Electorate Figures - Boundary Commission for England". 2011 Electorate Figures. Boundary Commission for England. 4 March 2011. http://www.boundarycommissionforengland.org.uk/electoral-figures/electoral-figures.htm. Retrieved 13 March 2011.
- ^ Leigh Rayment's Historical List of MPs – Constituencies beginning with "A" (part 3)
- ^ "UKIP: Ashford". UKIP. http://candidates.ukip.org/index.php?pg=show&eid=191. Retrieved 5 April 2010.
- ^ "Politcs Resources". Election 1997. Politics Resources. 1 May 1997. http://www.politicsresources.net/area/uk/constit/388.htm. Retrieved 2010-12-25.
- ^ C. Rallings & M. Thrasher, The Media Guide to the New Parliamentary Constituencies, p.120 (Plymouth: LGC Elections Centre, 1995)
- ^ "Politics Resources". Election 1992. Politics Resources. 9 April 1992. http://www.politicsresources.net/area/uk/ge92/ge92index.htm. Retrieved 6 December 2010.
Sources
- British Parliamentary Election Results 1885-1918, compiled and edited by F.W.S. Craig (Macmillan Press 1974)
- Iain Dale, ed (2003). The Times House of Commons 1929, 1931, 1935. Politico's (reprint). ISBN 1-84275-033-X.
- The Times House of Commons 1945. The Times. 1945.
- The Times House of Commons 1950. The Times. 1950.
- The Times House of Commons 1955. The Times. 1955.
Locations in the
parish of AshfordBuildings Ashford International Station · Ashford railway works · Church · East Hill Mill · Victoria Flour MillsBusinesses Ailsa Craig Engines · Ashford Designer Outlet · Brake Bros Ltd · County Square · H.S. Pledge & Sons Ltd · Kentish ExpressEvents Military People Political Schools Ashford School · Highworth School · John Wallis Academy · South Kent College · The North School · The Norton Knatchbull SchoolSport, arts and leisure Media Ashford Herald · Kentish Express · KMFM AshfordTwin towns Categories:- Parliamentary constituencies in Kent
- Ashford, Kent
- United Kingdom Parliamentary constituencies established in 1885


Wikimedia Foundation. 2010.