- Newbury (UK Parliament constituency)
-
Newbury County constituency for the House of Commons 
Boundary of Newbury in Berkshire.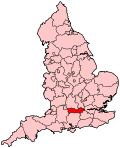
Location of Berkshire within England.County Berkshire Electorate 77,898 (December 2010)[1] Major settlements Newbury, Thatcham, Hungerford Current constituency Created 1885 Member of Parliament Richard Benyon (Conservative) Number of members One Created from Berkshire Overlaps European Parliament constituency South East England Newbury is a parliamentary constituency represented in the House of Commons of the Parliament of the United Kingdom. It returns one Member of Parliament (MP), elected by the first-past-the-post voting system.
The constituency consisting of Newbury, Thatcham, Hungerford and a large part of the surrounding area of West Berkshire. To the east, parts of West Berkshire have been incorporated into the Wokingham or Reading West constituencies. It is part of the South East region of England.
It is currently represented by the Conservative Richard Benyon, who won the seat in the 2005 general election from David Rendel of the Liberal Democrats.
Boundaries
 A graph plotting the election results for Newbury.
(larger version and key)As West Berkshire is a unitary authority and not a county, as is the rest of Berkshire, the Boundary Commission treats Berkshire as a whole, they are not constrained by the borders of West Berkshire.
The Boundary Commission's current recommendation is to move the Sulhamstead ward from the Newbury constituency to Wokingham. Currently the ward is split between the two.
The constituencies bordering Newbury (clockwise from north) are: Wantage, Henley, Reading West, Wokingham, Basingstoke, North West Hampshire, and Devizes.
History
 The Newbury constituency in 1954.
Originally, Newbury was part of a larger constituency of Berkshire, which returned two Members of Parliament (MPs), increased to three in the Reform Act of 1832. In the Redistribution of Seats Act of 1885 Berkshire (excluding Reading) was divided into three parts, Northern (Abingdon), Southern (Newbury), and Eastern (Wokingham), returning one member each. Furthermore, there was a borough constituency for Reading which also returned one MP.
For European Parliament elections, from 1979 to 1984 Newbury was part of the Upper Thames constituency, from 1984 to 1994 it was part of the Wiltshire constituency, and from 1994 to 1999 it was part of the Hampshire North and Oxford constituency. Since 1999 Newbury has formed part of the South East England constituency elected by a form of proportional representation.
Members of Parliament
Over the course of the constituency's history there have been eleven different Members of Parliament. Of those, all but three have been Conservatives. The total period served by either a Liberal or Liberal Democrat MP is 17 years, Conservative MPs have served for the remaining 103 years.
An incumbent MP has been defeated just four times, in the elections of 1906, 1923, 1924, and 2005.
The longest serving MP was Howard Clifton Brown who was MP for two periods, the first lasting one year and the second lasting twenty one years, making a total of twenty two years as an MP.
Election Member[2] Party 1885 William George Mount Conservative 1900 William Arthur Mount Conservative 1906 Frederick Coleridge Mackarness Liberal 1910 William Arthur Mount Conservative 1922 Howard Clifton Brown Conservative 1923 Innes Harold Stranger Liberal 1924 Howard Clifton Brown Conservative 1945 Anthony Hurd Conservative 1964 John Astor Conservative Feb 1974 Michael McNair-Wilson Conservative 1992 Judith Chaplin Conservative 1993 by-election David Rendel Liberal Democrat 2005 Richard Benyon Conservative Elections
Elections in the 2010s
General Election 2010: Newbury[3] Party Candidate Votes % ±% Conservative Richard Benyon 33,057 56.4 +7.4 Liberal Democrat David Rendel 20,809 35.5 -7.1 Labour Hannah Cooper 2,505 4.3 -1.7 UKIP David Black 1,475 2.5 +0.9 Green Adrian Hollister 490 0.8 +0.8 Independent Brian Burgess 158 0.3 +0.3 Apolitical Democrat David Yates 95 0.2 +0.2 Majority 12,248 20.9 +14.6 Turnout 58,589 70.2 -2.4 Conservative hold Swing 7.3 Elections in the 2000s
In the UK general election of 2005 David Rendel's small majority was overturned by Richard Benyon for the Conservative Party. It was their 30th target seat.
General Election 2005: Newbury Party Candidate Votes % ±% Conservative Richard Benyon 26,771 49.0 +5.5 Liberal Democrat David Rendel 23,311 42.6 −5.6 Labour Oscar Van Nooijen 3,239 5.9 −1.0 UKIP David McMahon 857 1.6 +0.3 Independent Nick Cornish 409 0.7 Independent Barrie Singleton 86 0.2 Majority 3,460 6.3 N/A Turnout 54,673 72.0 +4.7 Conservative gain from Liberal Democrat Swing The 2001 general election saw David Rendel returned with a smaller majority of 2,415. Turnout was above average at 67.3%.
General Election 2001: Newbury Party Candidate Votes % ±% Liberal Democrat David Rendel 24,507 48.2 −4.7 Conservative Richard Benyon 22,092 43.5 +5.7 Labour Steve Billcliffe 3,523 6.9 +1.4 UKIP Delphine Gray-Fisk 685 1.4 +0.9 Majority 2,415 4.8 −10.3 Turnout 50,807 67.3 −9.0 Liberal Democrat hold Swing Elections in the 1990s
In the 1997 general election, contrary to many expectations, David Rendel managed to keep hold of his seat.
General Election 1997: Newbury Party Candidate Votes % ±% Liberal Democrat David Rendel 29,887 52.9 +15.8 Conservative Richard Benyon 21,370 37.8 -18.1 Labour Paul Hannon 3,107 5.5 -0.6 Referendum Party Ted Snook 992 1.8 Green Rachel Stark 644 1.1 UKIP R Tubb 302 0.5 Socialist Labour Katrina Howse 174 0.3 Majority 8,517 15.1 −23.1 Turnout 56,476 76.3 +5.0 Liberal Democrat hold Swing Main article: Newbury by-election, 1993The Newbury by-election of 1993 was held after Judith Chaplin died. It was won by David Rendel with an impressive swing of 27.8%. However, turnout was down on the previous year at 71.3%. The by-election in Newbury was the first in a string of by-election losses for the Conservative Party. It is also famed for having a very long ballot paper.
This table shows the top ten candidates in the by-election, for the full results see the main article.
By-election 1993: Newbury Party Candidate Votes % ±% Liberal Democrat David Rendel 37,590 65.1 +27.8 Conservative Julian Davidson 15,535 26.9 −29.0 Labour Steve Billcliffe 1,151 2.0 −4.0 Anti-Federalist League Alan Sked 601 1.0 Conservative Candidate Andrew Bannon 561 1.0 Commoners' Party Stephen Martin 435 0.8 Monster Raving Loony Screaming Lord Sutch 432 0.7 Green Jim Wallis 341 0.6 −0.2 Referendum Party Robin Marlar 338 0.6 Conservative Rebel John Browne 267 0.5 Majority 22,055 38.2 Turnout 57,399 71.3 −11.46 Liberal Democrat gain from Conservative Swing In the 1992 general election the new Conservative Party candidate won the seat with an absolute majority. The turnout was 82.76%, higher than the nationwide average. Labour achieved their fifth worst result of the 1992 election in Newbury with only a 6.0% share of the vote.
General Election 1992: Newbury[4] Party Candidate Votes % ±% Conservative Judith Chaplin 37,135 55.9 −4.2 Liberal Democrat David Rendel 24 778 37.3 +5.6 Labour Richard J E Hall 3,962 6.0 −2.1 Green Jim Wallis 539 0.8 N/A Majority 12,357 18.6 −9.8 Turnout 66,414 82.8 +4.8 Conservative hold Swing −4.9 Elections in the 1980s
General Election 1987: Newbury Party Candidate Votes % ±% Conservative Michael McNair-Wilson 35,266 60.1 +0.8 SDP–Liberal Alliance (Liberal) David Rendel 18,608 31.7 −3.3 Labour Robert Stapley 4,765 8.1 +2.5 Majority 16,658 28.4 +4.1 Turnout 58,639 78.0 +2.8 Conservative hold Swing General Election 1983: Newbury Party Candidate Votes % ±% Conservative Michael McNair-Wilson 31,836 59.3 +6.2 SDP–Liberal Alliance (Liberal) Anthony Richards 18,798 35.0 −1.0 Labour Richard Knight 3,027 5.6 −5.2 Majority 13,038 24.3 +7.2 Turnout 53,661 75.2 Conservative hold Swing Elections in the 1970s
General Election 1979: Newbury Party Candidate Votes % ±% Conservative Michael McNair-Wilson 33,677 52.8 +10.4 Liberal Anthony Richards 23,388 36.7 −3.9 Labour Joan Ruddock 6,676 10.5 −6.2 Majority 10,289 16.1 +14.3 Turnout 63,741 79.3 +3.0 Conservative hold Swing After the 1970 general election, Newbury's boundary's were altered to reduce the size of the electorate which had grown to over 85,000. After the boundary changes, the electorate numbered around 72,000 people. This came into effect for the first general election in February 1974.
General Election October 1974: Newbury Party Candidate Votes % ±% Conservative Michael McNair-Wilson 23,499 42.4 +0.1 Liberal Dane Clouston 22,477 40.6 +0.3 Labour Celia Fletcher 9,390 16.7 −0.6 Majority 1,022 1.8 −0.2 Turnout 55,366 76.3 −4.6 Conservative hold Swing General Election February 1974: Newbury Party Candidate Votes % ±% Conservative Michael McNair-Wilson 24,620 42.4 Liberal Dane Clouston 23,419 40.3 +19.0 Labour Celia Fletcher 10,935 17.3 Majority 1,201 2.1 Turnout 58,974 80.8 +8.2 Conservative hold Swing General Election 1970: Newbury Party Candidate Votes % ±% Conservative John Astor 30,380 48.8 +3.5 Labour Timothy Sims 18,647 29.9 −8.1 Liberal Dane Clouston 13,279 21.3 +4.6 Majority 11,733 18.8 +11.6 Turnout 55,392 72.6 −6.5 Conservative hold Swing Elections in the 1960s
General Election 1966: Newbury Party Candidate Votes % ±% Conservative John Astor 25,908 45.3 −0.1 Labour Ronald Spiller 21,762 38.0 +3.6 Liberal Stanley Clement Davies 9,571 16.7 −3.5 Majority 4,146 7.2 −3.7 Turnout 57,241 79.1 −0.2 Conservative hold Swing General Election 1964: Newbury Party Candidate Votes % ±% Conservative John Astor 24,936 45.3 -14.6 Labour David Stoddart 18,943 34.4 +5.5 Liberal Denis Egginton 11,124 20.2 Majority 5,993 10.9 −9.1 Turnout 55,003 79.3 +0.6 Conservative hold Swing Elections in the 1950s
General Election 1959: Newbury Party Candidate Votes % ±% Conservative Anthony Hurd 29,703 60.0 +2.0 Labour David Stoddart 19,787 40.0 −2.0 Majority 9,916 20.0 +4.0 Turnout 49,490 78.7 +0.4 Conservative hold Swing General Election 1955: Newbury Party Candidate Votes % ±% Conservative Anthony Hurd 29,703 58.1 −1.7 Labour Jon Evans 18,843 41.9 +1.7 Majority 7,237 16.0 −3.6 Turnout 48,546 78.3 −0.4 Conservative hold Swing General Election 1951: Newbury Party Candidate Votes % ±% Conservative Anthony Hurd 20,102 59.8 +7.0 Labour Colin Jackson 13,507 40.2 +5.5 Majority 6,595 19.6 +1.5 Turnout 33,609 78.7 −2.4 Conservative hold Swing General Election 1950: Newbury Party Candidate Votes % ±% Conservative Anthony Hurd 18,150 52.8 Labour Colin Jackson 11,914 34.7 Liberal E. Burrows 4,284 12.5 Majority 6,236 18.1 Turnout 34,348 81.1 Conservative hold Swing Elections in the 1940s
General Election 1945: Newbury Party Candidate Votes % ±% Conservative Anthony Hurd 24,463 52.4 −20.6 Labour Mrs I. Brook 15,754 33.7 +6.7 Liberal E. D. T. Vane 6,052 13.0 N/A Common Wealth George Suggett 424 0.9 N/A Majority 8,709 18.7 −27.3 Turnout 46,693 65.4 −0.4 Conservative hold Swing Elections in the 1930s
General Election 1935: Newbury Party Candidate Votes % ±% Conservative Howard Clifton Brown 24,642 73.0 Labour Richard Russell 9,125 27.0 Majority 15,517 46.0 Turnout 33,767 65.5 Conservative hold Swing In the 1931 general election, Howard Clifton Brown of the Conservative Party was re-elected unopposed.
Elections in the 1920s
General Election 1929: Newbury Party Candidate Votes % ±% Conservative Howard Clifton Brown 17,800 51.0 −4.9 Liberal E. Harold Brooks 13,604 39.0 −0.5 Labour F. M. Jacques 3,471 10.0 +5.4 Majority 4,196 12.0 −4.4 Turnout 34,875 78.3 −2.6 Conservative hold Swing General Election 1924: Newbury Party Candidate Votes % ±% Conservative Howard Clifton Brown 14,759 55.90 +6 Liberal Innes Harold Stranger 10,444 39.50 −10.6 Labour F. M. Jacques 1,219 4.60 +4.60 Majority 4,315 16.40 N/A Turnout 26,422 80.90 +9.6 Conservative gain from Liberal Swing General Election 1923: Newbury Party Candidate Votes % ±% Liberal Innes Harold Stranger 11,226 50.1 +7.5 Conservative Howard Clifton Brown 11,185 49.9 −7.5 Majority 41 0.2 N/A Turnout 22,411 71.3 +1.6 Liberal gain from Conservative Swing +7.5 General Election 1922: Newbury Party Candidate Votes % ±% Conservative Howard Clifton Brown 12,322 57.4 Liberal Innes Harold Stranger 9,144 42.6 Majority 3,178 14.8 Turnout 21,466 69.7 Conservative hold Swing The by-election of June 10, 1922 saw Howard Clifton Brown returned as Newbury's MP unopposed.
Elections in the 1910s
The 1918 general election saw William Arthur Mount returned unopposed.
General Election December 1910: Newbury Party Candidate Votes % ±% Conservative William Arthur Mount 6,485 60.3 +0.3 Liberal Captain Lisle March-Phillipps 4,278 39.7 −0.3 Majority 2,207 20.5 +0.5 Turnout 10,763 82.4 &minus8.0 Conservative hold Swing General Election January 1910: Newbury Party Candidate Votes % ±% Conservative William Arthur Mount 7,081 60.0 +14.9 Liberal Thomas Hedderwick 4,723 40.0 −14.9 Majority 2,358 20.0 N/A Turnout 11,804 90.4 +2.9 Conservative gain from Liberal Swing Elections in the 1900s
In the 1906 general election the Liberal candidate, Frederick Mackarness won with a majority of 402 votes. Nationally there was also a large swing to the Liberal party, with the Conservatives losing 246 seats in total.
General Election 1906: Newbury Party Candidate Votes % ±% Liberal Frederick Mackarness 5,338 52.0 +8.7 Conservative William Arthur Mount 4,936 48.0 −8.7 Majority 402 3.9 N/A Turnout 10,274 87.5 Liberal gain from Conservative Swing +8.62 In the 1900 general election William Arthur Mount (Conservative) was returned as Newbury's MP unopposed.
Elections in the 1890s
General Election 1895: Newbury Party Candidate Votes % ±% Conservative William George Mount 4,936 56.7 +2.9 Liberal Sir John Swinburne 3,776 43.3 −2.9 Majority 1,160 13.3 +5.7 Turnout 8,712 Conservative hold Swing General Election 1892: Newbury Party Candidate Votes % ±% Conservative William George Mount 4,588 53.8 +2.7 Liberal T. Stevens 3,938 46.2 −2.7 Majority 650 7.6 +5.4 Turnout 8,526 Conservative hold Swing +2.7 Elections in the 1880s
In the general election of 1886 William George Mount (Conservative) was returned as Newbury's MP unopposed.
In the first general election in the Newbury constituency William George Mount for the Conservative Party won with a small majority of 202 votes over his Liberal opponent, G. Palmer.
General Election 1885: Newbury Party Candidate Votes % ±% Conservative William George Mount 4,631 51.1 Liberal G. Palmer 4,429 48.9 Majority 202 2.2 Turnout 9,060 See also
- List of Parliamentary constituencies in Berkshire
- List of Parliamentary constituencies in the United Kingdom
Notes and references
- ^ "Electorate Figures - Boundary Commission for England". 2011 Electorate Figures. Boundary Commission for England. 4 March 2011. http://www.boundarycommissionforengland.org.uk/electoral-figures/electoral-figures.htm. Retrieved 13 March 2011.
- ^ Leigh Rayment's Historical List of MPs – Constituencies beginning with "N" (part 1)
- ^ Newbury UK Polling
- ^ "Politics Resources". Election 1992. Politics Resources. 9 April 1992. http://www.politicsresources.net/area/uk/ge92/ge92index.htm. Retrieved 2010-12-06.
Sources
- "Newbury election history". Newbury. http://politics.guardian.co.uk/hoc/constituency/history/0,9571,-1151,00.html. Retrieved April 12, 2005.
- "Parliament.uk: 1992 elections" (PDF). Highest and lowest shares of the vote by party. http://www.parliament.uk/documents/upload/m13.pdf. Retrieved April 12, 2005.
- "Newbury 1993". Candidate names. Archived from the original on 2009-10-27. http://www.webcitation.org/query?url=http://www.geocities.com/by_elections/newbury.html&date=2009-10-26+22:18:07. Retrieved April 17, 2005.
- "Election data from 1832". Newbury constituency 1959 onwards. http://www.psr.keele.ac.uk/area/uk/edates.htm. Retrieved April 23, 2005.
- "Boundary Commission for England". Boundary changes. Archived from the original on March 12, 2005. http://web.archive.org/web/20050312082827/http://www.statistics.gov.uk/pbc/review_areas/berkshire.asp. Retrieved April 23, 2005.
- David Boothroyd. "Smallest majorities at elections since 1918". 1923 Majority. http://www.election.demon.co.uk/marginal.html. Retrieved June 3, 2005.
- BBC: Newbury constituency (2001)
- McCalmont, Frederick Haynes, Stenton Michael, Vincent, John Russell. McCalmont's parliamentary poll book: British election results. (ISBN 0-85527-000-4)
- F. W. S. Craig. British Parliamentary Election Results 1950-1973. (ISBN 0-900178-07-8)
- F. W. S. Craig. British Parliamentary Election Results 1918-1949. (ISBN 0-900178-01-9)
External links
- BBC News: Tories win Newbury from Lib Dems
- Independent story on the 2005 campaign
- West Berkshire Conservative Association
- David Rendel's Official Homepage
- Labour South East
- http://www.election-maps.co.uk
- Map of old Berkshire Constituency
Categories:- Parliamentary constituencies in Berkshire
- Newbury, Berkshire
- United Kingdom Parliamentary constituencies established in 1885


Wikimedia Foundation. 2010.