- North West Durham (UK Parliament constituency)
-
North West Durham County constituency for the House of Commons 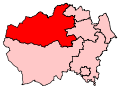
Boundary of North West Durham in County Durham.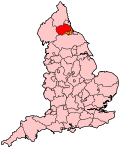
Location of County Durham within England.County County Durham Electorate 72,760 (December 2010)[1] Current constituency Created 1950 Member of Parliament Pat Glass (Labour) Number of members One Created from Barnard Castle 1885–1918 Number of members One Type of constituency County constituency Replaced by Consett Created from South Durham Overlaps European Parliament constituency North East England North West Durham is a county constituency represented in the House of Commons of the Parliament of the United Kingdom. It elects one Member of Parliament (MP) by the first past the post system of election. It is considered to be a safe seat for the Labour Party; the majority of the electorate live in former mining or steel towns, where Labour traditionally poll higher than other parties. The current MP is Pat Glass, elected at the 2010 general election.
Contents
Boundaries
The constituency is located in the north west of County Durham, in the North East England region. It consists of the western part of the former Derwentside district (including Consett and Lanchester) and the northern part of the former Wear Valley district (including Weardale, Crook and Willington).
Boundary review
Following its review of parliamentary representation in County Durham, the Boundary Commission for England has made minor changes to the existing North West Durham seat. It will be fought at the UK general election in 2010
The electoral wards used in the creation of the modified seat are;
- Crook North, Crook South, Howden, Hunwick, St John’s Chapel, Stanhope, Tow Law and Stanley, Wheatbottom and Helmington Row, Willington Central, Willington West End, and Wolsingham and Witton-le-Wear from the former Wear Valley district
- Benfieldside, Blackhill, Burnhope, Burnopfield, Castleside, Consett East, Consett North, Consett South, Cornsay, Delves Lane, Dipton, Ebchester and Medomsley, Esh, Lanchester and Leadgate from the former Derwentside district
Members of Parliament
MPs 1885–1918
Election Member[2] Party 1885 Llewellyn Archer Atherley-Jones Liberal 1914 by-election Aneurin Williams Liberal 1918 Constituency abolished MPs since 1950
Election Member[2] Party 1950 Constituency recreated 1950 James Murray Labour 1955 William Ainsley Labour 1964 Ernest Armstrong Labour 1987 Hilary Armstrong Labour 2010 Pat Glass Labour Elections
Elections in the 2010s
General Election 2010: North West Durham[3][4] Party Candidate Votes % ±% Labour Pat Glass 18,539 42.3 -11.6 Liberal Democrat Owen Temple 10,927 24.9 +5.0 Conservative Michelle Tempest 8,766 20.0 +3.6 Independent Watts Stelling 2,472 5.6 -4.2 BNP Michael Stewart 1,852 4.2 +4.2 UKIP Andrew McDonald 1,259 2.9 +2.9 Majority 7,612 17.4 Turnout 43,815 62.0 +4.2 Labour hold Swing -8.3 Elections in the 2000s
General Election 2005: North West Durham Party Candidate Votes % ±% Labour Hilary Armstrong 21,312 53.9 -8.6 Liberal Democrat Alan Ord 7,869 19.9 +5.0 Conservative Jamie Devlin 6,463 16.4 -4.5 Independent Watts Stelling 3,865 9.8 +9.8 Majority 13,443 34.0 Turnout 39,509 58.0 -0.5 Labour hold Swing -6.8 General Election 2001: North West Durham Party Candidate Votes % ±% Labour Hilary Armstrong 24,526 62.5 -6.2 Conservative William Clouston 8,193 20.9 +5.6 Liberal Democrat Alan Ord 5,846 14.9 +4.1 Socialist Labour Joan Hartnell 661 1.7 N/A Majority 16,333 41.6 Turnout 39,226 58.5 -10.2 Labour hold Swing -5.9 Elections in the 1990s
General Election 1997: North West Durham Party Candidate Votes % ±% Labour Hilary Armstrong 31,855 68.8 +10.7 Conservative Louise St John-Howe 7,101 15.3 -12.0 Liberal Democrat Anthony Gillings 4,991 10.8 -3.9 Referendum Party Rodney Atkinson 2,372 5.1 +5.1 Majority 24,754 53.5 Turnout 46,319 68.7 -6.8 Labour hold Swing 11.4 General Election 1992: North West Durham[5] Party Candidate Votes % ±% Labour Hilary Armstrong 26,734 57.8 +6.9 Conservative Theresa May 12,747 27.6 -0.8 Liberal Democrat Tim Farron 6,728 14.6 -6.1 Majority 13,987 30.2 +7.7 Turnout 46,209 75.5 +2.0 Labour hold Swing 3.4 Elections in the 1980s
General Election 1987: North West Durham Party Candidate Votes % ±% Labour Hilary Armstrong 22,947 50.9 Conservative D Iceton 12,785 28.36 SDP–Liberal Alliance C Foote Wood 9,349 20.74 Majority 10,162 22.54 Turnout 45,081 73.54 General Election 1983: North West Durham[6] Party Candidate Votes % ±% Labour Ernest Armstrong 19,135 44.58 Conservative T Middleton 12,779 29.77 SDP–Liberal Alliance C Foote Wood 11,008 25.65 Majority 6,356 14.81 Turnout 42,923 70.66 Elections in the 1970s
General Election 1979: North West Durham[7] Party Candidate Votes % ±% Labour Ernest Armstrong 29,525 61.3 Conservative T Fenwick 14,245 29.58 Liberal J Hannibell 4,394 9.12 Majority 15,280 31.72 Turnout 48,161 75.98 General Election October 1974: North West Durham[8] Party Candidate Votes % ±% Labour Ernest Armstrong 27,953 64.16 Conservative MJB Cookson 9,197 21.11 Liberal JK Forster 6,418 14.73 Majority 18,756 43.05 Turnout 43,566 71.09 General Election February 1974: North West Durham[9] Party Candidate Votes % ±% Labour Ernest Armstrong 28,326 59.01 Conservative J Riddell 10,865 22.64 Liberal JK Forster 8,809 18.35 Majority 17,461 36.38 Turnout 47,999 79.09 General Election 1970: North West Durham[10] Party Candidate Votes % ±% Labour Ernest Armstrong 24,245 69.6 Conservative AE Page 10,590 30.4 Majority 13,655 39.2 Turnout 34,834 72.85 See also
Notes and references
- ^ "Electorate Figures - Boundary Commission for England". 2011 Electorate Figures. Boundary Commission for England. 4 March 2011. http://www.boundarycommissionforengland.org.uk/electoral-figures/electoral-figures.htm. Retrieved 13 March 2011.
- ^ a b Leigh Rayment's Historical List of MPs – Constituencies beginning with "D" (part 4)
- ^ http://www.durham.gov.uk/PDFApproved/ParliamentaryElection2010_SoPN_Rev_NWD.pdf
- ^ "BBC NEWS – Election 2010 – Durham North West". BBC News. http://news.bbc.co.uk/1/shared/election2010/results/constituency/d30.stm.
- ^ "Politics Resources". Election 1992. Politics Resources. 9 April 1992. http://www.politicsresources.net/area/uk/ge92/ge92index.htm. Retrieved 2010-12-06.
- ^ http://www.politicsresources.net/area/uk/ge83/i07.htm
- ^ http://www.politicsresources.net/area/uk/ge79/i07.htm
- ^ http://www.politicsresources.net/area/uk/ge74b/i07.htm
- ^ http://www.politicsresources.net/area/uk/ge74a/i07.htm
- ^ http://www.politicsresources.net/area/uk/ge70/i07.htm
Constituencies in North East England (29) Labour (25) Bishop Auckland · Blaydon · Blyth Valley · City of Durham · Darlington · Easington · Gateshead · Hartlepool · Houghton and Sunderland South · Jarrow · Middlesbrough · Middlesbrough South and East Cleveland · Newcastle upon Tyne Central · Newcastle upon Tyne East · Newcastle upon Tyne North · North Durham · North Tyneside · North West Durham · Sedgefield · South Shields · Stockton North · Sunderland Central · Tynemouth · Wansbeck · Washington and Sunderland West
Conservative (2) Liberal Democrats (2) Categories:- Parliamentary constituencies in County Durham
- United Kingdom Parliamentary constituencies established in 1885
- United Kingdom Parliamentary constituencies disestablished in 1918
- United Kingdom Parliamentary constituencies established in 1950


Wikimedia Foundation. 2010.