- North Tyneside (UK Parliament constituency)
-
Coordinates: 55°00′29″N 1°32′46″W / 55.008°N 1.546°W
North Tyneside Borough constituency for the House of Commons 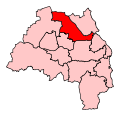
Boundary of North Tyneside in Tyne and Wear for the 2010 general election.
Location of Tyne and Wear within England.County Tyne and Wear Electorate 78,617 (December 2010)[1] Current constituency Created 1997 Member of Parliament Mary Glindon (Labour) Number of members One Created from Tynemouth and Wallsend Overlaps European Parliament constituency North East England North Tyneside is a constituency represented in the House of Commons of the Parliament of the United Kingdom. It elects one Member of Parliament (MP) by the first past the post system of election.
Contents
Boundaries
Boundary review
Following their review of parliamentary representation in Tyne and Wear, the Boundary Commission for England has created a modified North Tyneside constituency to be fought for the first time at the 2010 UK general election.
The seat contains Wallsend, which has been moved from Newcastle upon Tyne East and Wallsend. As a consequence of the changes, Newcastle East becomes a constituency in its own right.
The electoral wards used to form the modified North Tyneside constituency are;
- Battle Hill, Benton, Camperdown, Howdon, Killingworth, Longbenton, Northumberland, Riverside, Wallsend and Weetslade
The electoral ward of Northumberland should not be confused with the county of that name.
Members of Parliament
The seat was represented after its creation in 1997 by Stephen Byers of the Labour Party, who previously represented the former seat of Wallsend from 1992. Byers stood down at the 2010 general election, and his party selected local councillor Mary Glindon as their new candidate for the general election, which she won with a majority of 12,884.
Election Member [2] Party 1997 Stephen Byers Labour 2010 Mary Glindon Labour Elections
Elections in the 2010s
General Election 2010: North Tyneside[3] Party Candidate Votes % ±% Labour Mary Glindon 23,505 50.7 -8.7 Liberal Democrat David Ord 10,621 22.9 +0.9 Conservative Gagan Mohindra 8,514 18.3 -0.3 BNP John Burrows 1,860 4.0 N/A UKIP Claudia Blake 1,306 2.8 N/A National Front Bob Batten 599 1.3 N/A Majority 12,884 27.8 Turnout 46,405 59.7 +4.3 Labour hold Swing -4.8 Elections in the 2000s
General Election 2005: North Tyneside Party Candidate Votes % ±% Labour Stephen Byers 22,882 61.9 -7.6 Conservative Duncan McLellan 7,845 21.2 +6.6 Liberal Democrat Gillian Ferguson 6,212 16.8 +4.4 Majority 15,037 40.7 Turnout 36,939 57.2 -0.5 Labour hold Swing -7.1 General Election 2001: North Tyneside Party Candidate Votes % ±% Labour Stephen Byers 26,027 69.5 -3.3 Conservative Mark Ruffell 5,459 14.6 +0.9 Liberal Democrat Simon Reed 4,649 12.4 +1.9 UKIP Alan Taylor 770 2.1 N/A Socialist Alliance Pete Burnett 324 0.9 N/A Socialist Labour Kenneth Capstick 240 0.6 N/A Majority 20,568 54.9 Turnout 37,469 57.7 -10.2 Labour hold Swing Elections in the 1990s
General Election 1997: North Tyneside Party Candidate Votes % ±% Labour Stephen Byers 32,810 72.7 Conservative Michael McIntyre 6,167 13.7 Liberal Democrat Tommy Mulvenna 4,762 10.6 Referendum Party Michael Rollings 1,382 3.1 Majority 26,643 Turnout 67.9 See also
Notes and references
- ^ "Electorate Figures - Boundary Commission for England". 2011 Electorate Figures. Boundary Commission for England. 4 March 2011. http://www.boundarycommissionforengland.org.uk/electoral-figures/electoral-figures.htm. Retrieved 13 March 2011.
- ^ Leigh Rayment's Historical List of MPs – Constituencies beginning with "T" (part 2)
- ^ http://www.northtyneside.gov.uk/pls/portal/NTC_PSCM.PSCM_Web.download?p_ID=514458
Constituencies in North East England (29) Labour (25) Bishop Auckland · Blaydon · Blyth Valley · City of Durham · Darlington · Easington · Gateshead · Hartlepool · Houghton and Sunderland South · Jarrow · Middlesbrough · Middlesbrough South and East Cleveland · Newcastle upon Tyne Central · Newcastle upon Tyne East · Newcastle upon Tyne North · North Durham · North Tyneside · North West Durham · Sedgefield · South Shields · Stockton North · Sunderland Central · Tynemouth · Wansbeck · Washington and Sunderland West
Conservative (2) Liberal Democrats (2) North East England European constituency: Labour (1) · Conservative (1) · Liberal Democrats (1) Categories:- Parliamentary constituencies in Tyne and Wear
- United Kingdom Parliamentary constituencies established in 1997
- North Tyneside
- United Kingdom constituency stubs


Wikimedia Foundation. 2010.