- Military production during World War II
-
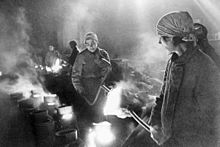
 Starving Russian women were working in factories even during the most terrible days of the Siege of Leningrad
Military production during World War II was a critical component to military performance during WWII. Over the course of the war, the Allied countries outproduced the Axis countries in most categories of weapons.
Contents
Gross domestic product (GDP)
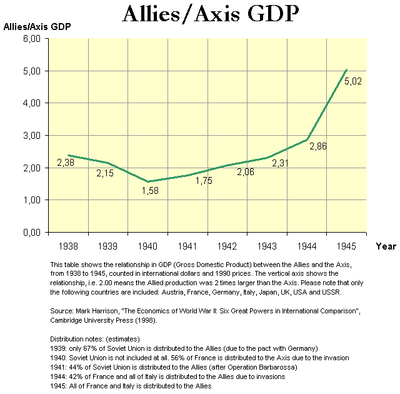
 This chart shows the relationship in GDP between the Allied and the Axis during 1938-1945.
This table shows the relationships in Gross domestic product (GDP), between a selection of Allied and Axis countries, from 1938 to 1945, counted in billion international dollars and 1990 prices.
Country 1938 1939 1940 1941 1942 1943 1944 1945 Austria 24 27 27 29 27 28 29 12 France[1] 186 199 164 130 116 110 93 101 Germany 351 384 387 412 417 426 437 310 Italy[2] 141 151 147 144 145 137 117 92 Japan[3] 169 184 192 196 197 194 189 144 Soviet Union[4] 359 366 417 359 274 305 362 343 British Isles 284 287 316 344 353 361 346 331 USA[5] 800 869 943 1 094 1 235 1 399 1 499 1 474 Allied Total:[6] 1 629 1 600 1 331 1 596 1 862 2 065 2 363 2 341 Axis Total:[7] 685 746 845 911 902 895 826 466 Allied/Axis GDP:[8] 2.38 2.15 1.58 1.75 2.06 2.31 2.86 5.02 Notes on the table (remember that the distribution values are rough estimates):
- ^ France-Axis distribution: 1940: 56%, 1941-43: 100%, 1944: 58%.
- ^ Italy distribution: 1938-1943: 100% Axis, 1944-1945: 100% Allies
- ^ Japanese values are included in Axis totals for all years in order to illustrate potential contribution
- ^ Soviet Union-Allies distribution: 1939: Only 67% due to the pact with Germany, but none to Axis. During 1940 Soviet Union is not counted at all. 1941: 44% is distributed to the Allies (after Operation Barbarossa), 1942-1945: 100%.
- ^ US values are included in Allied totals for all years in order to illustrate potential contribution & Lend-Lease
- ^ The Allied total is not the immediate sum of the table values; see the distribution rules used above.
- ^ The Axis total is not the immediate sum of the table values; see the distribution rules used above.
- ^ Allied/Axis GDP: This row shows the relation in GDP between the Allies and the Axis; i.e. 2.00 means the Allied production was 2 times larger than the Axis. Please note that only a selection of countries are included in the table. The distribution of values into alliances is described in the previous notes.
Table data source: Harrison, Mark, "The Economics of World War II: Six Great Powers in International Comparison", Cambridge University Press (1998).
Summary of production
System Allies Axis Tanks and SP guns 227,235 52,345 Artillery 914,683 180,141 Mortars 657,318 100,000+ Machineguns 4,744,484 1,058,863 Military trucks 3,060,354 594,859 Military aircraft total 633,072 278,795 Fighter aircraft 212,459 90,684 Attack aircraft 37,549 12,539 Bomber aircraft 153,615 35,415 Reconnaissance aircraft 7,885 13,033 Transport aircraft 43,045 5,657 Training aircraft 93,578 28,516 Aircraft carriers 155 16 Battleships 13 7 Cruisers 82 15 Destroyers 814 86 Convoy escorts 1,102 - Submarines 422 1,336 Merchant shipping tonnage 33,993,230 5,000,000+ Other: Pillboxes, bunkers (steel, concrete - uk only) 72,128,141 tonnes 132,685,348 tonnes Estimate Concrete runways 10,000,000 tonnes Note that most Battleships and Cruisers were produced before the war and many served through its entirety.
Vehicles and ground weapons
Country Total tanks and self-propelled guns Tanks and self-propelled guns [1] Artillery [2] Mortars [3] Machineguns [4] Military trucks Soviet Union 105,251 92,595 516,648 200,300 1,477,400 197,100 United States 88,410 71,067 257,390 105,055 2,679,840 2,382,311 United Kingdom 27,896 124,877 102,950 297,336 480,943 Canada 5,678 2150 43,552 251,925 815,729 Other Commonwealth 5,215 46,014 37,983 Germany 67,429 43,920 159,147 73,484 674,280 345,914 Japan 2,515 13,350 380,000 165,945 Italy 2,473 7,200 83,000 Hungary 500 447 4,583 Aircraft
Country Military aircraft of all types Fighter aircraft Attack aircraft Bomber aircraft Transport aircraft Training aircraft Soviet Union 143,145 63,087 37,549 21,116 17,332 4,061 United States 324,750 99,950 97,810 23,929 57,623 United Kingdom 131,549 49,422 34,689 1,784[5] 31,864 Canada 16,431 1740 1134 2670 France [6] 4,016 1,597[7] 280 712 Other Commonwealth 3,081 Germany 119,307 55,727 12,539 18,449 [8][9] 3,079 11,546 Japan 76,320 30,447 15,117 2,110 15,201 Italy 11,122 4,510 2,063 468 1,769 Hungary 1,046 Romania 1,000 Country Aircraft carriers [10] Battleships Cruisers Destroyers Convoy escorts Submarines Merchant tonnage Soviet Union 2 25 52 United States 22 (141) 8 48 349 420 203[11] 33,993,230 United Kingdom 14 (25) 5 32 240 413 167 6,378,899 Canada 1 303[12] 3,742,100 Other Commonwealth 3 60+ 2,702,943 Germany 0 [13] 2 17 23 1,141[11] Japan 16 2 9 63 167 4,152,361 Italy 0 [14] 3 6 6 28 1,469,606 Large Scale Civil Engineering Construction
Country Concrete bunkers and pillboxes [15] United Kingdom 72,128,141 Germany 132,685,348 Concrete runways
10,000,000 tonnes [16][dead link]
Materials
Country Coal [17] Iron Ore[17] Crude Oil[17] Soviet Union 590.8 71.3 110.6 United States 2,149.7 396.9 833.2 United Kingdom 1,441.2 119.2 90.8 Canada 101.9 3.6 8.4 Germany 2,420.3 240.7 33.4 [18] Japan 184.5 21.0 5.2 Italy 16.9 4.4 Hungary 6.6 14.1 3.1 Romania 1.6 10.8 25.0 See also: Swedish iron ore during World War IISee also
- American armored fighting vehicle production during World War II
- Army-Navy ‘E’ Award
- German armored fighting vehicle production during World War II
- Rosie the Riveter
- Soviet armored fighting vehicle production during World War II
- World War II aircraft production
- World War II
Notes
- ^ Those equipped with main weapons of 75 mm calibre or larger. This number is a subset of the total number.
- ^ Includes anti-aircraft and anti-tank weapons with calibres above 37 mm.
- ^ Over 60 mm.
- ^ Does not include sub-machineguns, or machine guns used for arming aircraft.
- ^ By agreement, the UK drew most of its transport aircraft, excepting converted bombers, from the US allowing it to concentrate on production of bombers
- ^ France production figures are from 09/39 to 06/40.
- ^ 542 MS.406 + 437 D.520+ 518 MB.151+ 80 C.714 + 20 VG-33.
- ^ The number of Nazi Germany bomber aircraft does not include more than 3,172 operational V-2 rockets and approximately 10,000 operational V-1 unmanned aircrafts used by for bombing.
- ^ 214 Ar 234 + 475 Do 17 + 1,366 Do 217 + 5,656 He 111 + 1,146 He 177 + 9,122 Ju 88 + 466 Ju 188 + 4 Ju 388
- ^ Figure in parentheses indicates merchant vessels converted to Escort carriers.
- ^ a b Wagner, Kennedy, Osborne, and Reyburn. The Library of Congress World War II Companion. pp 202-203.
- ^ Number of ships in the RCN All escort vessels of the frigate, minesweeper and corvettes classes were built in Canada and 10 Corvettes were supplied to the USN.
- ^ None completed by the end of the war. Two were in production , Graf Zeppelin and Flugzeugträger B.
- ^ None completed by the end of the war. Two were in production: see Aquila and Sparviero.
- ^ Tonnes of steel and concrete.
- ^ http://energydiscussiongroup.wikispaces.com/file/view/war+tonnages.xls An estimate of the rates of production carried out in WW2 as a guide to how quickly a crash programme of renewables could be built by comparison.
- ^ a b c In millions of tonnes (metric ton) (1 tonne = ~7.2 barrels of oil)
- ^ Including 23.4 synthetic.
References
- GDP values: Harrison, Mark, "The Economics of World War II: Six Great Powers in International Comparison", Cambridge University Press (1998).
- Milward, Alan S., "War, economy, and society, 1939-1945", University of California Press (1979).
- Overy, Richard, "Why the Allies Won (Paperback)", W. W. Norton & Company; Reprint edition (1997).
- Barnett, Correlli, "The audit of war : the illusion & reality of Britain as a great nation", Macmillan, (1986).
- 'Gross Domestic Product' 1940
- "Canada at War" wwii.ca
External links
Categories:- Military equipment of World War II
Wikimedia Foundation. 2010.


