- Mount Royal (electoral district)
-
Not to be confused with Mont-Royal (provincial electoral district).
Mount Royal  Quebec electoral district
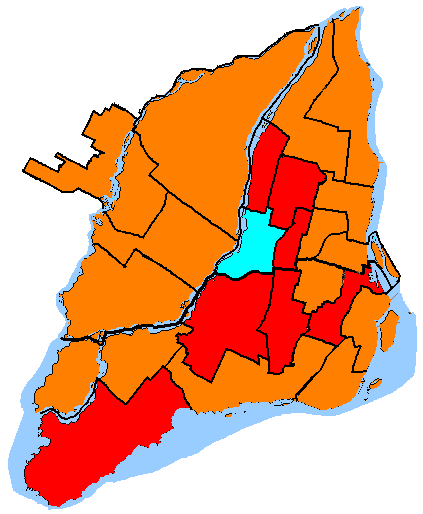
Mount Royal in relation to other federal electoral districts in Montreal Federal electoral district Legislature House of Commons MP
Irwin Cotler
LiberalDistrict created 1924 First contested 1925 Last contested 2011 District webpage profile, map Demographics Population (2006) 98,888 Electors (2011) 68,211 Area (km²) 23 Pop. density (per km²) 4,299.5 Census divisions Montreal Census subdivisions Montreal, Côte Saint-Luc, Mount Royal, Hampstead Mount Royal is a federal electoral district in Quebec, Canada, that has been represented in the Canadian House of Commons since 1925. Its population in 2006 was 98,888.
It is the most Liberal riding in Quebec and probably in the country; the Liberals have held the seat continuously since 1940. Réal Caouette, long-time leader of the Social Credit Party in Quebec, once said that a mailbox could win the Liberal nomination in Mount Royal and still win election just because it was red (the traditional colour of the Liberal Party).
Its best-known MP is former Prime Minister Pierre Trudeau, who represented the riding from 1965 to 1984. Its current MP, Irwin Cotler, has held the seat since 1999 when he won a riding-record 91.98 percent of the vote in a by-election.
Its official name in French is Mont-Royal.
The riding has a large Jewish population -- 36.3 percent. Mount Royal and Thornhill in Ontario are the only two districts in Canada where Judaism is the most commonly practised religion.
Contents
Geography
The district includes the City of Côte Saint-Luc, the Towns of Mount Royal and Hampstead, the neighbourhood of Snowdon and the western part of the neighbourhood of Côte-des-Neiges in the City of Montreal.
Demographics
- According to the Canada 2006 Census
- Racial groups: 65.4% White, 9.2% Filipino, 6.2% South Asian, 5.5% Black, 3.3% Chinese, 3.1% Southeast Asian, 2.9% Arab, 1.9% Latin American, 1.0% West Asian
- Languages: 32.2% English, 21.1% French, 45.7% Others
- Religions (2001): 36.3% Jewish, 29.3% Catholic, 6.8% Protestant, 5.6% Muslim, 4.9% Christian Orthodox, 4.5% Hindu, 3.0% Buddhist, 1.6% Other Christian
- Average income: $21,933
History
The electoral district was created in 1924 from Jacques-Cartier and Westmount—Saint-Henri ridings. The electoral district was actually abolished twice since 1924, in 1966 and in 1987, however the district to replace it kept the same name and incumbent both times.
Members of Parliament
This riding has elected the following Members of Parliament:
Parliament Years Member Party Jacques-Cartier and Westmount—St. Henri prior to 1924 15th 1925–1926 Robert Smeaton White Conservative 16th 1926–1930 17th 1930–1935 18th 1935–1940 William Allen Walsh Conservative 19th 1940–1945 Fred Whitman Liberal 20th 1945–1949 21st 1949–1953 Alan Macnaughton Liberal 22nd 1953–1957 23rd 1957–1958 24th 1958–1962 25th 1962–1963 26th 1963–1965 27th 1965–1968 Pierre Trudeau Liberal 28th 1968–1972 29th 1972–1974 30th 1974–1979 31st 1979–1980 32nd 1980–1984 33rd 1984–1988 Sheila Finestone Liberal 34th 1988–1993 35th 1993–1997 36th 1997–1999 1999–2000 Irwin Cotler Liberal 37th 2000–2004 38th 2004–2006 39th 2006–2008 40th 2008–2011 41st 2011–present Election results
Canadian federal election, 2011 Party Candidate Votes % ±% Expenditures Liberal Irwin Cotler 16,151 41.41 -14.24 Conservative Saulie Zajdel 13,891 35.61 +8.28 New Democrat Jeff Itcush 6,963 17.85 +10.13 Bloc Québécois Gabriel Dumais 1,136 2.91 -1.45 Green Brian Sarwer-Foner 683 1.75 -2.67 Marxist–Leninist Diane Johnston 109 0.28 +0.01 Not affiliated Abraham Weizfeld 74 0.19 Total valid votes/Expense limit 39,007 100.00 Total rejected ballots 312 0.79 +0.04 Turnout 39,319 57.64 +5.34 Canadian federal election, 2008 Party Candidate Votes % ±% Expenditures Liberal Irwin Cotler 19,702 55.65 -9.90 $70,302 Conservative Rafael Tzoubari 9,676 27.33 +9.43 $63,120 New Democrat Nicolas Thibodeau 2,733 7.72 +1.02 $3,089 Green Tyrell Alexander 1,565 4.42 +0.57 $600 Bloc Québécois Maryse Lavallée 1,543 4.36 -1.35 $6,931 Marxist–Leninist Diane Johnston 97 0.27 -0.02 Communist Antonio Artuso 89 0.25 $907 Total valid votes/Expense limit 35,405 100.00 $80,838 Total rejected ballots 268 0.75 +0.06 Turnout 35,673 52.30 -0.51 Canadian federal election, 2006 Party Candidate Votes % ±% Expenditures Liberal Irwin Cotler 24,248 65.55 -10.13 $66,099 Conservative Neil Martin Drabkin 6,621 17.90 +9.27 $41,404 New Democrat Nicolas R. Thibodeau 2,479 6.70 +1.79 $2,810 Bloc Québécois Guillaume Dussault 2,112 5.71 -1.25 $8,542 Green Damien Pichereau 1,423 3.85 +1.09 Marxist–Leninist Diane Johnston 106 0.29 +0.04 Total valid votes/Expense limit 36,989 100.00 $75,740 Total rejected ballots 241 0.65 -0.18 Turnout 37,230 52.81 -0.59 Canadian federal election, 2004 Party Candidate Votes % ±% Expenditures Liberal Irwin Cotler 28,670 75.68 -5.56 $79,191 Conservative Matthew Fireman 3,271 8.63 -1.02 $16,501 Bloc Québécois Vincent Gagnon 2,636 6.96 +2.69 $5,960 New Democrat Sébastien Beaudet 1,859 4.91 +2.37 $2,199 Green Adam Sommerfeld 1,046 2.76 +1.09 Marijuana Adam Greenblatt 308 0.81 Marxist–Leninist Diane Johnston 94 0.25 Total valid votes/Expense limit 37,884 100.00 $74,792 Total rejected ballots 317 0.83 Turnout 38,201 53.40 Note: Conservative vote is compared to the total of the Canadian Alliance vote and Progressive Conservative vote in 2000 election.
Canadian federal election, 2000 Party Candidate Votes % ±% Liberal Irwin Cotler 33,118 81.24 -10.74 Progressive Conservative Stephane Gelgoot 2,489 6.11 +2.34 Bloc Québécois Jean-Sebastien Houle 1,740 4.27 +2.03 Canadian Alliance Alex Gabanski 1,444 3.54 New Democrat Maria Pia Chávez 1,034 2.54 +0.52 Green Jean-Claude Balu 681 1.67 Communist Judith Chafoya 140 0.34 Natural Law Ena Kahn 122 0.30 Total valid votes 40,768 100.00 By-election on 15 November 1999 Resignation of Sheila Finestone, 10 August 1999
Party Candidate Votes % ±% Liberal Irwin Cotler 15,820 91.98 +29.72 Progressive Conservative Noel Earl Alexander 648 3.77 -6.58 Bloc Québécois Mathieu Alarie 385 2.24 -1.86 New Democrat Serge Granger 347 2.02 +0.02 Total valid votes 17,200 100.00 Note: Canadian Alliance vote is compared to the Reform vote in 1997 election.
Canadian federal election, 1997 Party Candidate Votes % ±% Liberal Sheila Finestone 30,115 62.26 -20.68 Independent Howard Galganov 10,090 20.86 Progressive Conservative Carolyn Steinman 5,006 10.35 +4.57 Bloc Québécois Jacques Thibaudeau 1,981 4.10 -2.86 New Democrat Adam Giambrone 966 2.00 +0.33 Natural Law Ena Kahn 211 0.44 -0.21 Total valid votes 48,369 100.00 Canadian federal election, 1993 Party Candidate Votes % ±% Liberal Sheila Finestone 39,598 82.94 +23.09 Bloc Québécois Guillaume Dumas 3,324 6.96 Progressive Conservative Neil Drabkin 2,758 5.78 -26.17 New Democrat Michael Richard Werbowski 796 1.67 -3.70 Independent Harry Polansky 537 1.12 Natural Law Ken Matthews 312 0.65 National Kurtis Law 300 0.63 Commonwealth Georges Duchesnay 71 0.15 -0.09 Abolitionist Marie Vienneau 47 0.10 Total valid votes 47,743 100.00 Canadian federal election, 1988 Party Candidate Votes % ±% Liberal Sheila Finestone 27,354 59.85 +12.38 Progressive Conservative Robert Presser 14,601 31.95 -7.14 New Democrat Tariq Alvi 2,455 5.37 -4.52 Rhino Lady Be Ann Poulin 512 1.12 -0.50 Green Daniel Reicher 438 0.96 Independent Barry Goodman 165 0.36 Commonwealth Paul G. Fraleigh 108 0.24 +0.07 Not affiliated Abe Rosner 68 0.15 Total valid votes 45,701 100.00 Canadian federal election, 1984 Party Candidate Votes % ±% Liberal Sheila Finestone 22,716 47.47 -33.76 Progressive Conservative Sharon Wolfe 18,707 39.09 +28.52 New Democrat Nancy Pearson 4,735 9.89 +4.23 Rhino Claude Parachute Racine 776 1.62 -0.10 Nationaliste André Daoust 392 0.82 Libertarian Victor Lévis 338 0.71 +0.41 Independent Mark Sholzberg 110 0.23 Commonwealth Guy R. Huard 80 0.17 Total valid votes 47,854 100.00 Canadian federal election, 1980 Party Candidate Votes % ±% Liberal Pierre Trudeau 33,821 81.23 -3.9 Progressive Conservative Harry Bloomfield 4,402 10.57 +3.4 New Democrat David C. Winch 2,356 5.66 +1.7 Rhino Michel Flybin Rivard 715 1.72 +0.4 Independent Gordon Edwards 149 0.36 Libertarian Eddie Paul 126 0.30 Marxist–Leninist Liz Watkins 68 0.16 +0.0 Total valid votes 41,637 100.00 Canadian federal election, 1979 Party Candidate Votes % ±% Liberal Pierre Trudeau 43,202 85.2 +10.2 Progressive Conservative J. David Dejong 3,660 7.2 -6.1 New Democrat David C. Winch 2,023 4.0 -5.8 Social Credit Laflèche Trudeau 1,049 2.1 1.1 Rhino Jacques Ferron 649 1.3 Communist David G. Johnston 81 0.2 Marxist–Leninist Robert Verrier 61 0.1 -0.3 Total valid votes 50,725 100.0 Canadian federal election, 1974 Party Candidate Votes % ±% Liberal Pierre Trudeau 32,166 75.0 -5.6 Progressive Conservative Émile Mashaal 5,723 13.3 +3.6 New Democrat Joe Rabinovitch 4,214 9.8 +2.7 Social Credit Bertrand Marcil 414 1.0 -0.4 Independent Edward J. Sommer 211 0.5 Marxist–Leninist Robert A. Cruise 162 0.4 +0.2 Total valid votes 42,890 100.0 Canadian federal election, 1972 Party Candidate Votes % ±% Liberal Pierre Trudeau 36,875 80.6 -10.1 Progressive Conservative Andrew Albert Brichant 4,446 9.7 +5.0 New Democrat Harry Yudin 3,274 7.2 +3.3 Social Credit Alexander O. Bronstein 625 1.4 +1.2 Not affiliated Gaston Miron 433 0.9 Not affiliated Robert A. Cruise 80 0.2 Total valid votes 45,733 100.0 Note: Social Credit vote is compared to Ralliement créditiste vote in the 1968 election.
Canadian federal election, 1968 Party Candidate Votes % ±% Liberal Pierre Trudeau 37,402 90.8 +35.1 Progressive Conservative Huguette Marleau 1,965 4.8 -8.8 New Democrat Jussy Brainin 1,583 3.8 -25.8 Independent Walter Gallagher 182 0.4 Ralliement créditiste Michel Lamonde 80 0.2 -1.0 Total valid votes 41,212 100.0 Canadian federal election, 1965 Party Candidate Votes % ±% Liberal Pierre Trudeau 28,064 55.6 -14.7 New Democrat Charles Taylor 14,929 29.6 +13.1 Progressive Conservative Peter S. Wise 6,840 13.6 +2.9 Ralliement créditiste Michel Smith 598 1.2 -1.3 Total valid votes 50,431 100.0 Note: Ralliement créditiste vote is compared to Social Credit vote in the 1963 election.
Canadian federal election, 1963 Party Candidate Votes % ±% Liberal Alan Macnaughton 37,648 70.4 +7.3 New Democrat Charles Taylor 8,855 16.5 +3.8 Progressive Conservative Thomas Joseph Coonan 5,693 10.6 -12.0 Social Credit Austin G. Gordon 1,318 2.5 +0.8 Total valid votes 53,514 100.0 Canadian federal election, 1962 Party Candidate Votes % ±% Liberal Alan Macnaughton 31,654 63.0 +14.6 Progressive Conservative Stanley Shenkman 11,352 22.6 -24.7 New Democrat Charles Taylor 6,388 12.7 +8.4 Social Credit Henri-J. Bernard 845 1.7 Total valid votes 50,239 100.0 Note: NDP vote is compared to CCF vote in 1958 election.
Canadian federal election, 1958 Party Candidate Votes % ±% Liberal Alan Macnaughton 22,051 48.4 -12.0 Progressive Conservative Reginald J. Dawson 21,562 47.3 +11.4 Co-operative Commonwealth Harold Atwill 1,952 4.3 +0.6 Total valid votes 45,565 100.0 Canadian federal election, 1957 Party Candidate Votes % ±% Liberal Alan Macnaughton 23,330 60.4 -1.2 Progressive Conservative George Brown 13,861 35.9 +2.0 Co-operative Commonwealth Harold Atwill 1,420 3.7 +1.9 Total valid votes 38,611 100.0 Canadian federal election, 1953 Party Candidate Votes % ±% Liberal Alan Macnaughton 17,183 61.7 -2.2 Progressive Conservative Dudley Holden Kerr 9,460 33.9 -0.1 Labour-Progressive Norman Nerenberg 727 2.6 Co-operative Commonwealth Ross Worrall 500 1.8 -0.3 Total valid votes 27,870 100.0 Canadian federal election, 1949 Party Candidate Votes % ±% Liberal Alan Macnaughton 21,654 63.8 +17.1 Progressive Conservative Earle Moore 11,550 34.0 -5.7 Co-operative Commonwealth Ross Edward Worrall 719 2.1 -5.9 Total valid votes 33,923 100.0 Canadian federal election, 1945 Party Candidate Votes % ±% Liberal Frederick Primrose Whitman 20,925 46.8 -9.7 Progressive Conservative St. Clair Holland 17,798 39.8 +1.9 Co-operative Commonwealth John Stanley Allen 3,608 8.1 +2.4 Ind. Progressive Conservative Gilbert Layton 1,270 2.8 Labour-Progressive Beryl Truax 1,147 2.6 Total valid votes 44,748 100.0 Note: Progressive Conservative vote is compared to "National Government" vote in 1940 election.
Canadian federal election, 1940 Party Candidate Votes % ±% Liberal Frederick Primrose Whitman 19,858 56.5 +20.0 National Government William Allen Walsh 13,319 37.9 -11.6 Co-operative Commonwealth John Stanley Allen 1,983 5.6 +1.1 Total valid votes 35,160 100.0 Note: "National Government" vote is compared to Conservative vote in 1935 election.
Canadian federal election, 1935 Party Candidate Votes % ±% Conservative William Allen Walsh 16,203 49.4 -26.0 Liberal Adam Kirk Cameron 11,967 36.5 +12.0 Reconstruction Clifford Henry Cheasley 2,782 8.5 Co-operative Commonwealth Lloyd B. Almond 1,473 4.5 Independent Thomas Henry Carveth 343 1.0 Total valid votes 32,768 100.0 Canadian federal election, 1930 Party Candidate Votes % ±% Conservative Robert Smeaton White 19,932 75.5 -0.5 Liberal Grace Ritchie England 6,483 24.5 +0.5 Total valid votes 26,415 100.0 Canadian federal election, 1926 Party Candidate Votes % ±% Conservative Robert Smeaton White 14,249 76.0 +6.3 Liberal Thomas Henry Carveth 4,499 24.0 Total valid votes 18,748 100.0 Canadian federal election, 1925 Party Candidate Votes % Conservative Robert Smeaton White 16,377 69.7 Independent Liberal Robert Louis Calder 7,129 30.3 Total valid votes 23,506 100.0 Parliament of Canada Preceded by
Algoma EastRiding represented by the Prime Minister
1968-1979Succeeded by
YellowheadPreceded by
YellowheadRiding represented by the Prime Minister
1980-1984Succeeded by
Vacant; next was Manicouagan, in 1984See also
- List of Canadian federal electoral districts
- Past Canadian electoral districts
Sources
Riding history from the Library of Parliament:
External links
Political blog with discussion of Mount Royal:
Federal ridings in Montreal New Democratic 
Liberal Bourassa • Lac-Saint-Louis • Mount Royal • Papineau • Saint-Laurent—Cartierville • Saint-Léonard—Saint-Michel • Westmount—Ville-MarieBloc Québécois Categories:- Federal electoral districts of Montreal
- Quebec federal electoral districts

Wikimedia Foundation. 2010.