- Manicouagan (electoral district)
-
Manicouagan  Quebec electoral district
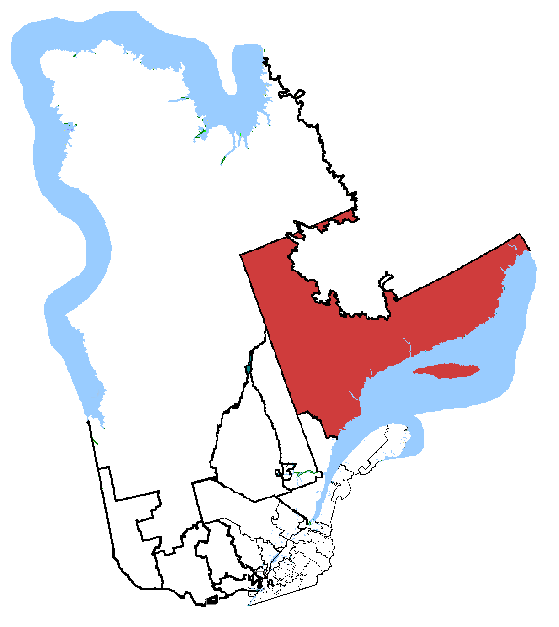
Manicouagan in relation to other Quebec federal electoral districts Federal electoral district Legislature House of Commons MP
Jonathan Genest-Jourdain
NDPDistrict created 1966 First contested 1968 Last contested 2011 District webpage profile, map Demographics Population (2006) 83,608 Electors (2011) 63,886 Area (km²) 252,365 Pop. density (per km²) 0.33 Census divisions Basse-Côte-Nord Territory, Caniapiscau RCM, Manicouagan RCM, Minganie RCM, Sept-Rivières RCM Census subdivisions Baie-Comeau, Betsiamites, Chute-aux-Outardes, Côte-Nord-du-Golfe-du-Saint-Laurent, Fermont, Havre-Saint-Pierre, Port-Cartier, Sept-Îles, Uashat-Maliotenam Manicouagan is a federal electoral district in Quebec, Canada, that has been represented in the Canadian House of Commons since 1968.
The riding was created in 1966 from parts of Charlevoix and Saguenay ridings.
The neighbouring ridings are Abitibi—Baie-James—Nunavik—Eeyou, Chicoutimi—Le Fjord, Montmorency—Charlevoix—Haute-Côte-Nord, Haute-Gaspésie—La Mitis—Matane—Matapédia, Gaspésie—Îles-de-la-Madeleine, and Labrador.
Contents
Members of Parliament
This riding has elected the following Members of Parliament:
Parliament Years Member Party Charlevoix and Saguenay prior to 1966 28th 1968–1972 Gustave Blouin Liberal 29th 1972–1974 30th 1974–1979 31st 1979–1980 André Maltais Liberal 32nd 1980–1984 33rd 1984–1988 Brian Mulroney Progressive Conservative 34th 1988–1993 Charles Langlois Progressive Conservative 35th 1993–1997 Bernard St-Laurent Bloc Québécois 1997 Independent 36th 1997–2000 Ghislain Fournier Bloc Québécois 37th 2000–2004 38th 2004–2006 Gérard Asselin Bloc Québécois 39th 2006–2008 40th 2008–2011 41st 2011–present Jonathan Genest-Jourdain New Democratic Election results
Canadian federal election, 2011 Party Candidate Votes % ±% Expenditures New Democrat Jonathan Genest-Jourdain 16,437 48.93 +44.1 Bloc Québécois Gérard Asselin 10,495 31.24 -18.1 Conservative Gordon Ferguson 3,878 11.55 -15.5 Liberal André Forbes[fn 1] 1,882 5.60 -9.7 Green Jacques Gélineau 898 2.67 -0.9 Total valid votes/Expense limit 33,590 100.00 Total rejected ballots 524 1.54 Turnout 34,114 52.10 Eligible voters 65,481 Canadian federal election, 2008 Party Candidate Votes % ±% Expenditures Bloc Québécois Gérard Asselin 15,272 49.3 -1.8 $60,396 Conservative Pierre Breton 8,374 27.0 +8.0 $57,909 Liberal Randy Jones 4,737 15.3 +1.0 $3,407 New Democrat Michaël Chicoine 1,491 4.8 -8.0 $228 Green Jacques Gélineau 1,112 3.6 +1.3 Total valid votes/Expense limit 30,986 100.0 $99,164 Total rejected ballots 444 1.4 Turnout 31,430 Canadian federal election, 2006 Party Candidate Votes % ±% Expenditures Bloc Québécois Gérard Asselin 18,601 51.1 -7.4 $59,792 Conservative Pierre Paradis 6,910 19.0 +14.1 $9,560 Liberal Randy Jones 5,214 14.3 -10.6 $22,979 New Democrat Pierre Ducasse 4,657 12.8 +2.5 $20,006 Green Jacques Gélineau 824 2.3 +0.9 Independent Eric Viver 195 0.5 Total valid votes/Expense limit 36,401 100.0 $92,367 Canadian federal election, 2004 Party Candidate Votes % ±% Expenditures Bloc Québécois Gérard Asselin 19,040 58.5 +5.3 $55,212 Liberal Anthony Detroio 8,097 24.9 -10.8 $54,120 New Democrat Pierre Ducasse 3,361 10.3 +8.6 $23,174 Conservative Pierre Paradis 1,601 4.9 -4.4[fn 2] $4,449 Green Les Parsons 444 1.4 $905 Total valid votes/Expense limit 32,543 100.0 $90,297 Canadian federal election, 2000 Party Candidate Votes % ±% Bloc Québécois Ghislain Fournier 11,595 53.2 +6.2 Liberal Robert Labadie 7,770 35.7 -5.5 Canadian Alliance Laurette De Champlain 1,197 5.5 n/a Progressive Conservative Gaby-Gabriel Robert 830 3.8 -3.9 New Democrat Normand Caplette 386 1.8 -2.2 Total valid votes 21,778 100.0 Canadian federal election, 1997 Party Candidate Votes % ±% Bloc Québécois Ghislain Fournier 12,203 47.1 -7.9 Liberal André Maltais 10,671 41.2 +20.1 Progressive Conservative Michel Allard 2,009 7.7 -14.5 New Democrat Pierre Ducasse 1,041 4.0 +2.3 Total valid votes 25,924 100.0 Canadian federal election, 1993 Party Candidate Votes % ±% Bloc Québécois Bernard St-Laurent 14,859 55.0 n/a[fn 3] Progressive Conservative Charles Langlois 6,024 22.3 -39.4 Liberal Rita Lavoie 5,694 21.1 -1.8 New Democrat Eric Hébert 451 1.7 -12.8 Total valid votes 27,028 100.0 Canadian federal election, 1988 Party Candidate Votes % ±% Progressive Conservative Charles Langlois 17,126 61.7 -9.9 Liberal Sylvain Garneau 6,355 22.9 -1.6 New Democrat Carol Guay 4,008 14.4 +12.1 Commonwealth Alan John York 281 1.0 +0.8 Total valid votes 27,770 100.0 Canadian federal election, 1984 Party Candidate Votes % ±% Progressive Conservative Brian Mulroney 28,208 71.6 +56.1 Liberal André Maltais 9,640 24.5 -44.2 New Democrat Denis Faubert 939 2.4 -4.4 Nationaliste Laurian Dupont 536 1.4 Commonwealth Raynald Rouleau 101 0.3 Total valid votes 39,424 Canadian federal election, 1980 Party Candidate Votes % ±% Liberal André Maltais 21,499 68.6 10.0 Progressive Conservative Jacques Blouin 4,844 15.5 -0.2 New Democrat Roger Muller 2,111 6.7 +0.1 Social Credit Marcel Brin 1,184 3.8 -13.2 Rhino Yves Truchon 841 2.7 Rhino Denis Tarzan Bédard 715 2.3 Marxist–Leninist Lisette Paradis 125 0.4 Total valid votes 31,319 100.0 Canadian federal election, 1979 Party Candidate Votes % ±% Liberal André Maltais 18,528 58.6 -8.6 Social Credit Paul-Henri Tremblay 5,378 17.0 Progressive Conservative Denyse Patry 4,948 15.6 -1.0 New Democrat Carole Noel 2,105 6.7 -6.8 Union Populaire Gilles Verrier 659 2.1 Total valid votes 31,618 100.0 Canadian federal election, 1974 Party Candidate Votes % ±% Liberal Gustave Blouin 16,220 67.2 +10.7 Progressive Conservative Alban Malenfant 4,024 16.7 +1.1 New Democrat Raymond Perron 3,247 13.4 +6.2 Marxist–Leninist Gilles Verrier 659 2.7 Total valid votes 24,150 100.0 Canadian federal election, 1972 Party Candidate Votes % ±% Liberal Gustave Blouin 16,780 56.5 -4.1 Social Credit Lionel-Joseph Desjardins 6,136 20.7 +12.8 Progressive Conservative Jerry Giles 4,625 15.6 -4.8 New Democrat Jean-Maurice Pinel 2,156 7.3 -3.8 Total valid votes 29,697 100.0 Canadian federal election, 1968 Party Candidate Votes % Liberal Gustave Blouin 13,504 60.6 Progressive Conservative Jerry Giles 4,539 20.4 New Democrat Louis Rioux 2,463 11.1 Ralliement créditiste Roger Boulanger 1,761 7.9 Total valid votes 22,267 100.0 Notes
- ^ André Forbes was nominated as a Liberal, but lost party support just before the nomination deadline. Instead of resigning, he continued to run as an Independent. He appears on the ballot as a Liberal.[1][2]
- ^ Conservative vote is compared to the total of the Canadian Alliance vote and Progressive Conservative vote in 2000 election.
- ^ No BQ candidate in 1988 for comparison.
References
- ^ Booted Liberal candidate still in the race. TheSpec.com, 11 April 2011. Retrieved 13 April 2011.
- ^ Controversial Quebec Liberal to remain in race. CBC News, 11 April 2011. Retrieved 13 April 2011.
See also
- List of Canadian federal electoral districts
- Past Canadian electoral districts
Sources
New Democratic 
Conservative Parliament of Canada Preceded by
Mount RoyalConstituency represented by the Prime Minister
1984-1988Succeeded by
CharlevoixCategories:- Quebec federal electoral districts
- Baie-Comeau
- Sept-Îles, Quebec
Wikimedia Foundation. 2010.