- Saint John (electoral district)
-
Saint John  New Brunswick electoral district
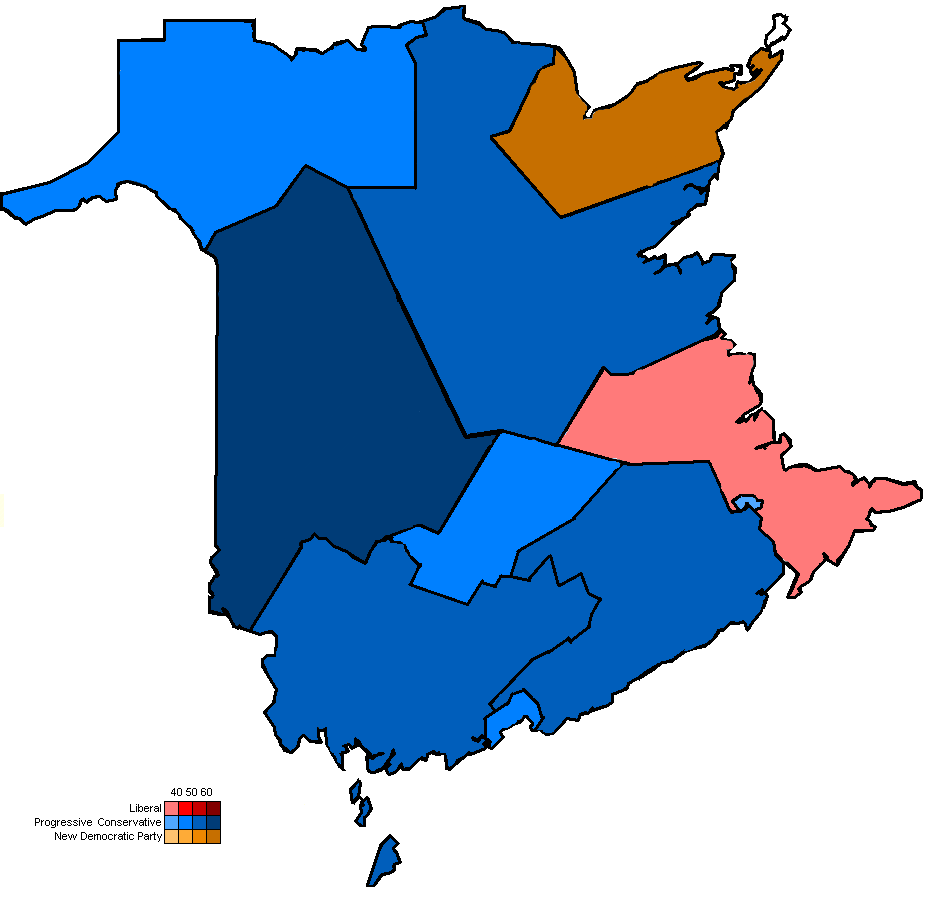
Saint John in relation to other New Brunswick federal electoral districts Federal electoral district Legislature House of Commons MP
Rodney Weston
ConservativeDistrict created 1914 First contested 1917 Last contested 2008 District webpage profile, map Demographics Population (2006) 82,078 Electors (2011) 64,868 Area (km²) 450 Pop. density (per km²) 182.4 Census divisions Saint John Census subdivisions Saint John Saint John is a federal electoral district in southern New Brunswick, Canada. With its predecessor ridings, St. John—Albert and Saint John—Lancaster, the area has been represented in the Canadian House of Commons since 1917. Its population in 2001 was 83,463.
The district has always included the city of Saint John, and various suburbs and bedroom communities have been added or removed from it over the years. Presently the district also includes the town of Rothesay, the Indian reserve of Brothers 18 and about 16% of the town of Quispamsis including the neighbourhoods of Stoneycroft and Blairs.
The neighbouring ridings are Fundy Royal and New Brunswick Southwest.
Contents
History
Originally, Saint John had a special setup for representation in Parliament. The "City of St. John" returned one member, while the "City and County of St. John", which included the County of Saint John returned one as well. Between 1872 and 1896, the "City and County" riding elected two Members of Parliament. In effect, the city itself had two or even three Members of Parliament. This practice continued until 1914.
After 1914, the counties of Saint John and Albert were joined. The two existing ridings were merged into a new riding, called "St. John—Albert", that also incorporated parts of King's and Albert riding. The new riding returned two Members of Parliament until 1935.
In 1966, St. John—Albert was abolished when Albert County was moved to the Fundy—Royal riding. A new riding, "Saint John—Lancaster", was created.
Saint John—Lancaster was abolished in the 1976 redistribution, and a new riding with substantially the same boundaries was created and named "Saint John". The City of Lancaster had been amalgamated into Saint John.
In recent years, the Progressive Conservative Party has had the most success in the city: its members were elected in all but four elections since 1953: 1974, 1980, 2004, and 2006. Well-known Members of Parliament from the area include Father of Confederation Samuel Leonard Tilley, former Veterans Affairs Minister Gerald Merrithew and popular former mayor Elsie Wayne.
Members of Parliament
These ridings have elected the following Members of Parliament:
Parliament Years Member Party Member Party City and County of St. John prior to 1917 St. John—Albert 13th 1917–1921 Rupert Wilson Wigmore Unionist Stanley Edward Elkin Unionist 14th 1921–1925 John Babington Macaulay Baxter Conservative Murray MacLaren Conservative 15th 1925–1926 Thomas Bell Conservative 16th 1926–1930 17th 1930–1935 Parliament Years Member Party St. John—Albert returns only one member after 1935 18th 1935–1938 William Ryan Liberal 1938–1940 Allan McAvity Liberal 19th 1940–1945 King Hazen Progressive Conservative 20th 1945–1949 21st 1949–1953 Daniel Aloysius Riley Liberal 22nd 1953–1957 Thomas Miller Bell Progressive Conservative 23rd 1957–1958 24th 1958–1962 25th 1962–1963 26th 1963–1965 27th 1965–1968 Saint John—Lancaster 28th 1968–1972 Thomas Miller Bell Progressive Conservative 29th 1972–1974 30th 1974–1979 Mike Landers Liberal Saint John 31st 1979–1980 Eric Ferguson Progressive Conservative 32nd 1980–1984 Mike Landers Liberal 33rd 1984–1988 Gerald Merrithew Progressive Conservative 34th 1988–1993 35th 1993–1997 Elsie Wayne Progressive Conservative 36th 1997–2000 37th 2000–2003 2003–2004 Conservative 38th 2004–2006 Paul Zed Liberal 39th 2006–2008 40th 2008–2011 Rodney Weston Conservative 41st 2011–present Election results
Saint John, 1976 - present
Canadian federal election, 2011 Party Candidate Votes % ±% Expenditures Conservative Rodney Weston 18,456 49.7 +10.1 New Democrat Rob Moir 11,382 30.7 +14.7 Liberal Stephen Chase 5,964 16.1 -22.0 Green Sharon Murphy-Flatt 1,017 2.7 -1.7 Independent Arthur Watson Jr. 294 0.8 - Total valid votes/Expense limit 37,113 100.0 Total rejected ballots 176 0.5 0.0 Turnout 37,289 58.4 +4 Eligible voters 63,802 Canadian federal election, 2008 Party Candidate Votes % ±% Expenditures Conservative Rodney Weston 13,782 39.6 +0.3 $73,864 Liberal Paul Zed 13,285 38.1 -4.9 $53,553 New Democrat Tony Mowery 5,560 16.0 +0.3 $2,761 Green Mike Richardson 1,888 5.4 +3.3 $1,008 Marijuana Michael Moffat 330 0.9 Total valid votes/Expense limit 34,845 100.0 $79,702 Total rejected ballots 187 0.5 Turnout 35,032 54.0 Conservative gain from Liberal Swing -2.5 Canadian federal election, 2006 Party Candidate Votes % ±% Liberal Paul Zed 17,202 42.9 -0.4 Conservative John Wallace 15,753 39.3 +5.7 New Democrat Terry Albright 6,267 15.6 -3.4 Green Vern Garnett 858 2.1 -0.1 Total valid votes 40,080 100.0 Canadian federal election, 2004 Party Candidate Votes % ±% Liberal Paul Zed 15,725 43.3 +14.3 Conservative Bob McVicar 12,212 33.6 -26.4 New Democrat Terry Albright 6,926 19.0 +9.9 Green Jonathan Cormier 807 2.2 +1.9 Marijuana Jim Wood 369 1.0 -0.4 Independent Tom Oland 290 0.8 +0.8 Total valid votes 36,329 100.0 Canadian federal election, 2000 Party Candidate Votes % ±% Progressive Conservative Elsie Wayne 16,751 50.9 -12.2 Liberal Paul Zed 9,535 29.0 +13.1 New Democrat Rod Hill 2,989 9.1 -1.3 Canadian Alliance Peter Touchbourne 2,980 9.1 -0.7 Marijuana Jim Wood 461 1.4 +1.4 Green Vern Garnett 131 0.3 +0.3 Natural Law Miville Couture 52 0.2 -0.5 Total valid votes 32,899 100.0 Canadian federal election, 1997 Party Candidate Votes % ±% Progressive Conservative Elsie Wayne 22,227 63.1 +19.8 Liberal Diana Alexander 5,612 15.9 -17.7 New Democrat Larry Hanley 3,679 10.4 +6.3 Reform George Richardson 3,467 9.8 +3.6 Natural Law Christopher B. Collrin 232 0.7 n/c Total valid votes 35,217 100.0 Canadian federal election, 1993 Party Candidate Votes % ±% Progressive Conservative Elsie Wayne 15,123 43.3 +0.2 Liberal Pat Landers 11,736 33.6 -5.0 Independent Joe Boyce 3,685 10.6 +10.6 Reform John Erbs 2,171 6.2 +6.2 New Democrat Shirley Brown 1,443 4.1 -8.4 Canada Party Jim Webb 368 1.1 +1.1 Natural Law Christopher Collrin 252 0.7 +0.7 National Joy Hobson 146 0.4 +0.4 Total valid votes 34,924 100.0 Canadian federal election, 1988 Party Candidate Votes % ±% Progressive Conservative Gerry Merrithew 16,798 43.1 -9.1 Liberal Joe Boyce 15,067 38.6 +13.1 New Democrat Judith Meinert 4,883 12.5 -8.7 Confederation of Regions Jim Webb 1,806 4.6 +4.6 Libertarian Thomas Gamblin 289 0.7 -0.1 Independent Gary Zatzman 162 0.4 +0.4 Total valid votes 39,005 100.0 Canadian federal election, 1984 Party Candidate Votes % ±% Progressive Conservative Gerry Merrithew 16,604 52.2 +13.2 Liberal Cliff Warner 8,109 25.5 -15.9 New Democrat Mary Palmer 6,752 21.2 +2.3 Libertarian Peter Jones 242 0.8 +0.6 Social Credit Gordon Simons 102 0.3 +0.3 Total valid votes 31,809 100.0 Canadian federal election, 1980 Party Candidate Votes % ±% Liberal Mike Landers 13,122 41.4 +1.8 Progressive Conservative Eric Ferguson 12,363 39.0 -2.6 New Democrat David M. Brown 5,978 18.9 n/c Independent Marilynn Fox 103 0.3 +0.3 Libertarian Peter Jones 66 0.2 +0.2 Marxist–Leninist Gilles DesRosiers 35 0.1 +0.1 Total valid votes 31,667 100.0 Canadian federal election, 1979 Party Candidate Votes % ±% Progressive Conservative Eric Ferguson 13,989 41.6 +0.6 Liberal Mike Landers 13,316 39.6 -6.5 New Democrat Eldon Richardson 6,358 18.9 +6.5 Total valid votes 33,663 100.0 Saint John—Lancaster, 1966-1976
Canadian federal election, 1974 Party Candidate Votes % ±% Liberal Mike Landers 12,860 46.1 +3.9 Progressive Conservative Tom Bell 11,419 41.0 -12.9 New Democrat Eldon Richardson 3,457 12.4 +9.9 Marxist–Leninist Jay Baxter 118 0.4 +0.4 Total valid votes 27,854 100.0 Canadian federal election, 1972 Party Candidate Votes % ±% Progressive Conservative Tom Bell 16,350 53.9 +0.9 Liberal William Ryan 12,783 42.2 +1.2 New Democrat Joe Drummond 788 2.5 -2.6 Social Credit Tom Enright 394 1.3 +1.3 Total valid votes 30,315 100.0 Canadian federal election, 1968 Party Candidate Votes % ±% Progressive Conservative Tom Bell 15,756 53.0 +1.6 Liberal William Ryan 12,160 41.0 +4.4 New Democrat Eldon Richardson 1,508 5.1 -6.8 Independent Mildred Crawford 268 0.9 +0.9 Total valid votes 29,692 100.0 St. John—Albert 1914-1966
Canadian federal election, 1965 Party Candidate Votes % ±% Progressive Conservative Tom Bell 21,909 51.4 -0.3 Liberal Arthur Whelly 15,609 36.6 -3.3 New Democrat Eldon Richardson 5,081 11.9 +7.4 Total valid votes 42,599 100.0 Canadian federal election, 1963 Party Candidate Votes % ±% Progressive Conservative Tom Bell 21,584 51.7 -0.1 Liberal Arthur Whelly 16,669 39.9 +1.4 New Democrat John Simonds 1,869 4.5 -1.6 Social Credit Paul Sherwood 1,606 3.8 +0.1 Total valid votes 41,728 100.0 Canadian federal election, 1962 Party Candidate Votes % ±% Progressive Conservative Tom Bell 22,586 51.8 -12.1 Liberal George Urquhart 16,790 38.5 +5.6 New Democrat Eldon Richardson 2,641 6.1 +2.8 Social Credit Harvey Lainson 1,608 3.7 +3.7 Total valid votes 43,625 100.0 Canadian federal election, 1958 Party Candidate Votes % ±% Progressive Conservative Tom Bell 21,983 63.9 +10.3 Liberal George McLeod 13,917 32.9 -13.5 Co-operative Commonwealth Eldon Richardson 1,394 3.3 +3.3 Total valid votes 37,294 100.0 Canadian federal election, 1957 Party Candidate Votes % ±% Progressive Conservative Tom Bell 21,983 53.6 +4.1 Liberal Daniel Riley 19,047 46.4 -1.7 Total valid votes 41,030 100.0 Canadian federal election, 1953 Party Candidate Votes % ±% Progressive Conservative Tom Bell 18,881 49.5 +4.8 Liberal Daniel Riley 18,338 48.1 -0.8 Co-operative Commonwealth Raymond McAfee 933 2.4 -4.0 Total valid votes 38,152 100.0 Canadian federal election, 1949 Party Candidate Votes % ±% Liberal Daniel Riley 18,691 48.9 +7.8 Progressive Conservative Douglas King Hazen 17,052 44.7 -2.1 Co-operative Commonwealth Raymond McAfee 2,445 6.4 -5.6 Total valid votes 38,188 100.0 Canadian federal election, 1945 Party Candidate Votes % ±% Progressive Conservative Douglas King Hazen 16,205 46.8 -3.5 Liberal David Lawrence MacLaren 14,248 41.1 -6.1 Co-operative Commonwealth William Arrowsmith 761 12.0 +9.5 Total valid votes 31,214 100.0 Canadian federal election, 1940 Party Candidate Votes % ±% Conservative Douglas King Hazen 15,110 50.3 +13.4 Liberal Allan McAvity 14,197 47.2 -0.8 Co-operative Commonwealth James Fritch 761 2.5 +2.5 Total valid votes 30,068 100.0 Note: popular vote is compared to 1935 general election.
By-election on February 21, 1938 On William Ryan's death, April 1, 1938
Party Candidate Votes Liberal Allan McAvity acclaimed Canadian federal election, 1935 Party Candidate Votes % ±% Liberal William Ryan 15,125 48.0 +13.9 Conservative Douglas King Hazen 11,643 36.9 -19.0 Reconstruction Paul Cross 4,094 13.0 Independent Liberal Howe Cowan 672 2.1 Total valid votes 31,534 100.0 Note: popular vote is compared to the party's total share of the popular vote in the 1930 general election.
Canadian federal election, 1930 Party Candidate Votes % Elected Conservative Murray MacLaren 16,454 33.0 x Conservative Thomas Bell 16,395 32.9 x Liberal Allan McAvity 8,595 17.3 Liberal William Ryan 8,371 16.8 Total valid votes 49,815 100.0 Total Conservative vote: 32,849, or 65.9% of the total, an increase of 4.2% from the 1926 general election.
Total Liberal vote: 16,966, or 34.1%, a decrease of 4.2% from the 1926 general election.Canadian federal election, 1926 Party Candidate Votes % Elected Conservative Murray MacLaren 12,441 31.0 x Conservative Thomas Bell 12,310 30.7 x Liberal William Michael Ryan 8,007 20.0 Liberal Robert Thomas Hayes 7,356 18.3 Total valid votes 40,114 100.0% Total Conservative vote: 24,751, or 61.7% of the total, a decrease of 0.2% from the 1925 general election.
Total Liberal vote: 15,363, or 38.3% of the total, an increase of 0.2% from the 1925 general election.Canadian federal election, 1925 Party Candidate Votes % Elected Conservative Murray MacLaren 14,623 31.3 x Conservative Thomas Bell 14,250 30.5 x Liberal Walter Edward Foster 9,348 20.0 Liberal Robert Thomas Hayes 8,435 18.1 Total valid votes 46,656 100.0 Total Conservative vote: 28,873, or 61.9% of the total, an increase of 11.6% from the 1921 general election.
Total Liberal vote: 17,783, or 38.1% of the total, a decrease of 6.7% from the 1921 general election.Canadian federal election, 1921 Party Candidate Votes % Elected Conservative John Babington Baxter 11,646 26.0 x Conservative Murray MacLaren 10,901 24.3 x Liberal Harry Richards McLellan 10,531 23.5 Liberal William Patrick Broderick 9,546 21.3 Progressive Frederick Alexander Campbell 1,224 2.7 Progressive William Mayhew Calhoun 985 2.2 Total valid votes 44,833 100.0 Total Conservative vote: 22,547, or 50.3% of the total, an increase of 0.3% from the 1920 by-election.
Total Liberal vote: 20,077, or 44.8% of the total, a decrease of 5.2% from the 1920 by-election.
Total Progressive vote: 2,209, or 4.9% of the total.By-election on September 20, 1920 Party Candidate Votes % ±% Conservative Rupert Wilson Wigmore 13,611 50.0 -20.8 Liberal Alban Frederick Emery 13,594 50.0 +20.8 Total valid votes 27,205 100.0 Note: Conservative vote is compared to Government vote in 1917 election, and Liberal vote is compared to Opposition vote. Popular vote is compared to the party's total share of the popular vote in the 1917 general election.
Canadian federal election, 1917 Party Candidate Votes % Elected Government Rupert Wilson Wigmore 13,611 35.4 x Government Stanley Edward Elkin 13,594 35.4 x Liberal William Patrick Broderick 5,694 14.8 Liberal Alban Frederick Emery 5,530 14.4 Total valid votes 38,429 100.0 Total Conservative vote: 27,205, or 70.8% of the total.
Total Liberal vote: 11,224, or 29.2% of the total.See also
- List of Canadian federal electoral districts
- Past Canadian electoral districts
External links
- Riding history from the Library of Parliament:
- "History of Federal Electoral Ridings Since 1867". Library of Parliament. http://www2.parl.gc.ca/Sites/LOP/HFER/hfer.asp?Language=E. Retrieved August 5, 2004.
Federal ridings in New Brunswick Conservative Fredericton • Fundy Royal • Madawaska—Restigouche • Miramichi • Moncton—Riverview—Dieppe • New Brunswick Southwest • Saint John • Tobique—Mactaquac
Liberal New Democratic Categories:- New Brunswick federal electoral districts
- Saint John, New Brunswick

Wikimedia Foundation. 2010.