- Charlottetown (electoral district)
-
Charlottetown  Prince Edward Island electoral district
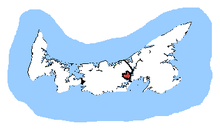
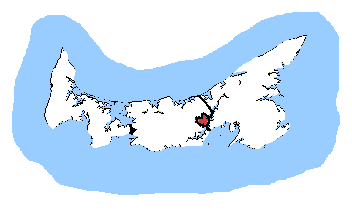
Charlottetown in relation to the other Prince Edward Island ridings Federal electoral district Legislature House of Commons MP
Sean Casey
LiberalDistrict created 2003 First contested 2004 Last contested 2011 District webpage profile, map Demographics Population (2006) 32,174 Electors (2011) 26,067 Area (km²) 46 Pop. density (per km²) 699.4 Census divisions Queens Census subdivisions Charlottetown Charlottetown is a federal electoral district in Prince Edward Island, Canada, that has been represented in the Canadian House of Commons since 2004. The district, which includes the entire City of Charlottetown, has an area of 46 km2 and a population of 32,245 as of 2001.
Contents
Demographics
- Ethnic groups: 97.2% White
- Languages: 94.8% English, 2.1% French, 2.5% Other
- Religions: 47.7% Catholic, 39.5% Protestant, 2.5% Other Christian, 8.3% no affiliation
- Average income: $26,205
History
From 1966 until 2004, most of the Charlottetown riding was part of the riding of Hillsborough. In 2003, there was a riding readjustment; some pieces of the old Hillsborough riding became part of Cardigan. 96.4% of the riding of Charlottetown was previously part of the Hillsborough riding, and 3.6% was previously part of Malpeque.
Member of Parliament
This riding has elected the following Members of Parliament:
Parliament Years Member Party Queen's prior to 1968 Hillsborough 28th 1968–1972 Heath MacQuarrie Progressive Conservative 29th 1972–1974 30th 1974–1979 31st 1979–1980 Tom McMillan Progressive Conservative 32nd 1980–1984 33rd 1984–1988 34th 1988–1993 George Proud Liberal 35th 1993–1997 36th 1997–2000 37th 2000–2004 Shawn Murphy Liberal Charlottetown 38th 2004–2006 Shawn Murphy Liberal 39th 2006–2008 40th 2008–2011 41st 2011–present Sean Casey Liberal Election results
Charlottetown 2004-present
Canadian federal election, 2011 Party Candidate Votes % ±% Expenditures Liberal Sean Casey 7,292 39.48 -10.58 Conservative Donna Profit 6,040 32.71 +0.60 New Democrat Joe Byrne 4,632 25.08 +12.77 Green Eliza Knockwood 417 2.26 -2.57 Christian Heritage Baird Judson 87 0.47 -0.23 Total valid votes/Expense limit 18,468 100.00 Total rejected ballots 113 0.61 -0.16 Turnout 18,581 70.10 +3.96 Eligible voters 26,507 Canadian federal election, 2008 Party Candidate Votes % ±% Expenditures Liberal Shawn Murphy 8,893 50.06 -0.10 $65,348 Conservative Tom DeBlois 5,704 32.11 -2.03 $48,872 New Democrat Brian Pollard 2,187 12.31 +1.19 $4,744 Green Laura Bisaillon 858 4.83 +1.76 $1,266 Christian Heritage Baird Judson 124 0.70 +0.19 $8,750 Total valid votes/Expense limit 17,776 100.00 $67,455 Total rejected ballots 137 0.77 +0.26 Turnout 17,913 66.14 Eligible voters 27,083 Canadian federal election, 2006 Party Candidate Votes % ±% Liberal Shawn Murphy 9,586 50.16 +0.80 Conservative Tom DeBlois 6,524 34.14 +6.59 New Democrat Brian Pollard 2,126 11.12 -7.32 Green David Daughton 586 3.07 -1.02 Marijuana Andrew J. Chisholm 193 1.01 Christian Heritage Baird Judson 97 0.51 -0.05 Total valid votes 19,112 100.00 Liberal hold Swing -2.9 Canadian federal election, 2004 Party Candidate Votes % ±% Liberal Shawn Murphy 9,175 49.36 +6.80 Conservative Darren Peters 5,121 27.55 -9.80 New Democrat Dody Crane 3,428 18.44 -2.90 Green Will McFadden 760 4.09 Christian Heritage Baird Judson 105 0.56 +0.30 Total valid votes 18,589 100.00 Change from 2000 is based on redistributed results. The Conservative Party change is based on the combination of Canadian Alliance and Progressive Conservative Party totals. The Christian Heritage Party change based on vote from previous election of the same candidate, who ran as an independent (the CHP was not recognized in that election.)
Hillsborough 1968-2004
Canadian federal election, 2000 Party Candidate Votes % ±% Liberal Shawn Murphy 8,277 41.81 Progressive Conservative Darren Peters 6,039 30.50 New Democrat Dody Crane 4,328 21.86 Canadian Alliance Gerry Stewart 1,005 5.08 Natural Law Peter Cameron 92 0.46 Independent Baird Judson 58 0.29 Turnout 19,895 67.2% Canadian federal election, 1997 Party Candidate Votes % ±% Liberal George Proud 7,630 40.87 New Democrat Dody Crane 5,751 30.80 Progressive Conservative Mitchell Tweel 4,594 24.61 Reform Blaine Jensen 476 2.55 Christian Heritage Baird Judson 145 0.78 Natural Law Paula Price 74 0.40 Turnout 18,847 71.2% Canadian federal election, 1993 Party Candidate Votes % ±% Liberal George Proud 11,976 60.57 Progressive Conservative Tom McMillan 5,269 26.65 New Democrat Dody Crane 1,143 5.78 Reform Freeman T. Whitty 744 3.76 National Dave Patterson 350 1.77 Christian Heritage Baird Judson 167 0.84 Natural Law Peter Cameron 123 0.62 Canadian federal election, 1988 Party Candidate Votes % ±% Liberal George Proud 8,897 43.68 Progressive Conservative Tom McMillan 8,638 42.41 New Democrat Dody Crane 1,984 5.78 Independent David Weale 569 2.79 Christian Heritage Baird Judson 281 1.38 Canadian federal election, 1984 Party Candidate Votes % ±% Progressive Conservative Tom McMillan 9,158 53.20 Liberal Gerry Birt 6,768 39.32 New Democrat David Burke 846 4.91 Independent Big John Muise 323 1.88 Independent Izzurd Goat McFadden 82 0.48 Green David Daughton 37 0.21 Canadian federal election, 1980 Party Candidate Votes % ±% Progressive Conservative Tom McMillan 7,128 47.66 Liberal Gerry Birt 6,555 43.83 New Democrat Bob Crockett 1,245 8.32 Marxist–Leninist Kathryn Schmidt 28 0.19 Canadian federal election, 1979 Party Candidate Votes % ±% Progressive Conservative Tom McMillan 8,338 54.99 Liberal Gordon Tweedy 5,319 35.08 New Democrat Bob Crockett 1,453 9.58 Libertarian Garry Anstett 54 0.36 Canadian federal election, 1974 Party Candidate Votes % ±% Progressive Conservative Heath MacQuarrie 9,917 50.36 Liberal George Chandler 8,577 43.56 New Democrat Preston MacLeod 1,197 6.08 Canadian federal election, 1972 Party Candidate Votes % ±% Progressive Conservative Heath MacQuarrie 10,605 55.13 Liberal Ian Glass 7,168 37.26 New Democrat Etsel Ross 1,464 7.61 Canadian federal election, 1968 Party Candidate Votes % ±% Progressive Conservative Heath MacQuarrie 8,328 54.99 Liberal Jack McAndrew 6,447 41.05 New Democrat David Hall 930 5.92 See also
- List of Canadian federal electoral districts
- Past Canadian electoral districts
References
- Riding history for Hillsborough (1966–2003) from the Library of Parliament
- Riding history for Charlottetown (2003–) from the Library of Parliament
- "Canada Votes 2006". CBC News. http://www.cbc.ca/canadavotes2006/riding/009/. Retrieved 20 December 2010.
Liberal 
Conservative Newfoundland and Labrador Nova Scotia Prince Edward Island New Brunswick Categories:- Politics of Charlottetown
- Prince Edward Island federal electoral districts
Wikimedia Foundation. 2010.