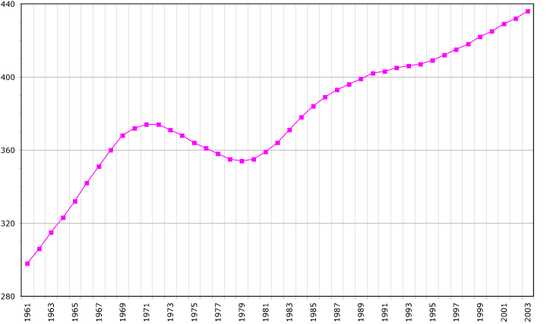
- Demographics of Suriname
-
This article is about the demographic features of the population of Suriname, including population density, ethnicity, education level, health of the populace, economic status, religious affiliations and other aspects of the population.
Most Surinamers live in the narrow, northern coastal plain. The population is one of the most ethnically varied in the world. Each ethnic group preserves its own culture and many institutions, including political parties, tend to follow ethnic lines. Informal relationships vary: the upper classes of all ethnic backgrounds mix freely; outside of the elite, social relations tend to remain within ethnic groupings. All groups may be found in the schools and workplace.
CIA World Factbook demographic statistics
The following demographic statistics are from the CIA World Factbook, unless otherwise indicated.
Population
470,784 (July 2007 est.)
Age structure
0–14 years: 32% (male 70,871; female 67,466)
15–64 years: 62% (male 137,209; female 131,905)
65 years and over: 6% (male 10,907; female 12,945) (2000 est.)Population growth rate
1.103% (2007 est.)
Birth rate
17.31 births/1,000 population (2007 est.)
Death rate
5.5 deaths/1,000 population (2007 est.)
Net migration rate
-0.78 migrant(s)/1,000 population (2007 est.)
Sex ratio
at birth: 1.05 male(s)/female
under 15 years: 1.05 male(s)/female
15–64 years: 1.04 male(s)/female
65 years and over: 0.84 male(s)/female
total population: 1.03 male(s)/female (2000 est.)Infant mortality rate
20.11 deaths/1,000 live births (2007 est.)
Life expectancy at birth
total population: 71.36 years
male: 68.71 years
female: 74.14 years (2000 est.)Total fertility rate
2.5 children born/woman (2000 est.)
Nationality
noun: Surinamer(s)
adjective: SurinameseEthnic groups
- Amerindian, the original inhabitants of Suriname. 2%,
- Hindustani, also known locally as East Indians; their ancestors emigrated from northern British India in the latter part of the 19th century to do indention work. 37%,
- Creole (mixed white and black) 31%,
- Javanese 15% (Southeast Asians),
- "Maroons" (their African ancestors were brought to the country in the 17th and 18th centuries as slaves and escaped to the interior) 8%,
- Chinese 8%,[1]
- White 5%,
and about 20,000 American expatriates from the United States.[citation needed]
Although there are official statistics available, the current population of Suriname is very different of these. Local estimates are
- 180,000 Hindustani (Indian descendants) estimates are up to 200-300,000 which can include unregistred immigrants from Trinidad and Tobago and Guyana,
- 150,000 Creole (Mixed African and European/Asian/Amerindian/Jewish etc.) Some estimates are higher because this figure exclude immigrants from Haiti, French Guiana, Dominican Republic and Guyana,
- 80,000 Maroon (African descendants),
- 75,000 Javanese (Asians from formerly Dutch-ruled Indonesia not limited to those from the island Java),
- 60,000 Brazilian (estimates varies between 20.000 and 80. 000) from Brazil. There are smaller numbers of South American nationalities, but are Spanish speakers included in the European category,
- 40,000 Chinese (with some estimates even higher) with quite small communities of Koreans, Japanese and Filipinos. [2]
- 12,000 to 24,000 Amerindian (esp. in the tropical rainforest south). It does not include Cherokees from the USA whom settled in the Guyanas in the 19th century[citation needed],
- 20,000 European (of which 8,000 are Dutch) included are small communities of British, French, German, Italian, Portuguese and Spanish descendants, all integrated to the Dutch European group,
- 2,000 Arab/Middle-eastern (mostly Lebanese but also Syrian and Palestinians).
- 200 Jews who are identified in ethnoreligious terms.
Religions
Protestant 25.2% (predominantly of the Moravian Church (Herrnhut)), Roman Catholic 22.8%, Hindu 27.4%, Muslim 19.6%, indigenous beliefs 5% and Judaism - a small active Jewish community.
Languages
Dutch (official), Sranan Tongo (Surinamese, sometimes called Taki-Taki, is native language of Creoles and much of the younger population), Hindustani (Hindi-Urdu), Javanese, English (widely spoken), French due to cultural influence from French Guiana, Portuguese and Spanish.
Literacy
definition: age 15 and over can read and write
total population: 93%
male: 95%
female: 91% (1995 est.)References
- ^ Romero, Simon (10). "With Aid and Migrants, China Expands Its Presence in a South American Nation". The New York Times. http://www.nytimes.com/2011/04/11/world/americas/11suriname.html. Retrieved 11 April 2011.
- ^ Romero, Simon (10). "With Aid and Migrants, China Expands Its Presence in a South American Nation". The New York Times. http://www.nytimes.com/2011/04/11/world/americas/11suriname.html. Retrieved 11 April 2011.
Demographics of South America Sovereign states Dependencies and
other territories- Aruba
- Bonaire
- Curaçao
- Falkland Islands
- French Guiana
- South Georgia and the South Sandwich Islands
Ethnic groups in Suriname Indigenous 
Non-Indigenous Categories:
Wikimedia Foundation. 2010.

